Stock Market Futures Outlook for September 29, 2016 –
Range bound behavior on the S&P 500 (INDEXSP:.INX) continues. The winning trader has been trading the range bound channel – moving in at price support and out at price resistance, or the reverse. We still need to pay attention to sellers at the top of the range near 2167-2169 on S&P 500 futures. Above there, we see 2176 as the next potential test north. Price support is shifted up into a tight area this morning near 2161, with 2154 below that. Choosing a trend to swing trade at this time seems like a fool’s errand while we remain congested. I suspect the stock market will hold very choppy formations into the election, and beyond into the dust settling space.
See today’s economic calendar with a rundown of releases.
TODAY’S RANGE OF MOTION
S&P 500 Futures Trading Outlook For September 29
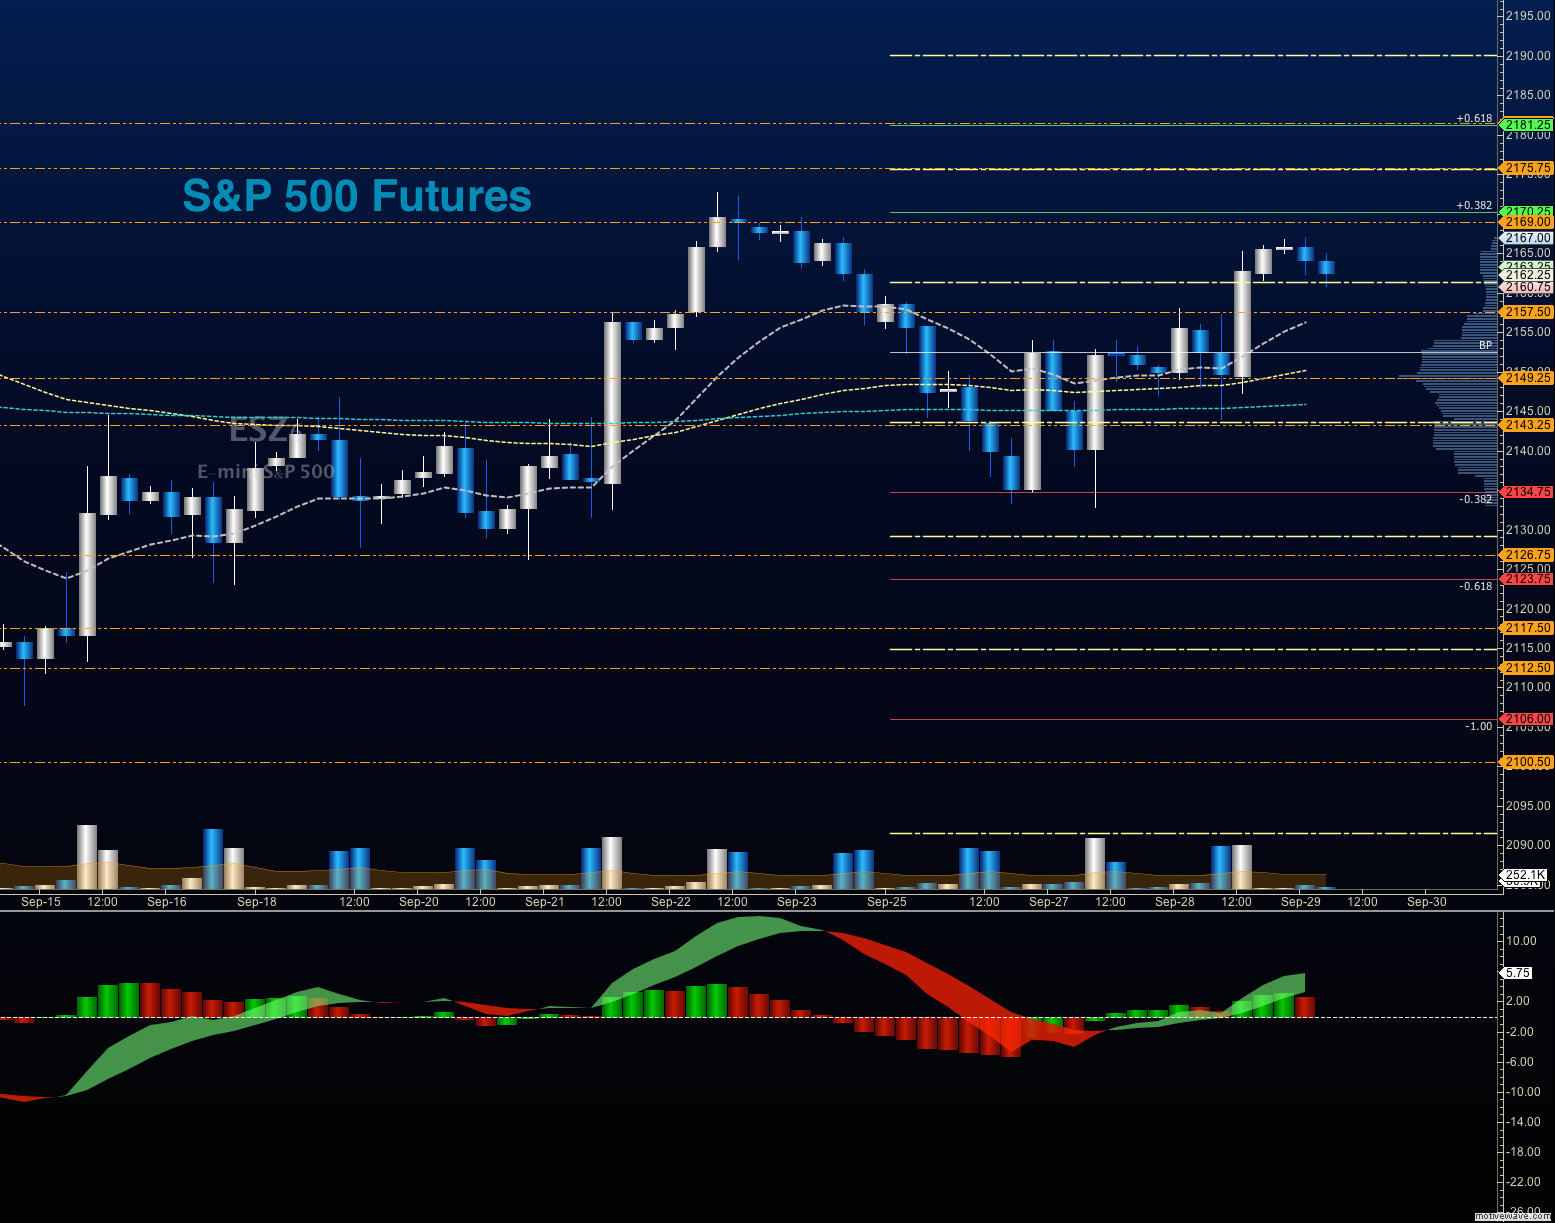
Upside trades on S&P 500 futures – Favorable setups sit on the positive retest of 2167.75, or a positive retest of the bounce off 2156.5 with upward momentum. Charts are very congested in these price ranges, so trading should be choppy. I use the 30min to 1hr chart for the breach and retest mechanic. Targets from 2156.5 are 2159, 2161.5, 2165.5, 2167, 2169, 2171.5, and 2174.5.
Downside trades on S&P 500 futures – Favorable setups sit below the failed retest of 2155, or at the failed retest of 2161.5 with negative divergence. Retracements into lower levels from 2161.5 give us the targets 2159, 2156.25, 2152.5, 2150.5, 2148.5, 2145.5, 2140.75, 2136.5, and 2133.75.
Nasdaq Futures
The NQ_F behaved as expected yesterday with big candlesticks and longer wicks. The 4hour candlestick beginning at 9am traced more than a 70 point range, with several 1 hour candlesticks tracing 15 points or more. Support levels continue to rise higher into the 4858 region. Resistance sits at 4876.25 this morning. It seems that a breach here might hold into 4883 -4887, but buyers have not presented strength at this writing, so tentative longs at support seem most reliable. The NQ_F is still in a breakout pattern, so pullbacks are likely to find buyers.
Upside trades on Nasdaq futures – Favorable setups sit on the positive retest of 4868.5, or a positive retest of 4858.75 with positive momentum. I use the 30min to 1hr chart for the breach and retest mechanic. Targets from 4858.75 are 4860.5, 4865.25, 4868.5, 4870.25, 4874.75, 4876.25, 4883.5 and 4887.25.
Downside trades on Nasdaq futures – Favorable setups sit below the failed retest of 4855, or at the failed retest of 4866.5 with negative divergence. Retracements into lower levels from 4866.5 are 4862.5, 4858.5, 4855.25, 4852, 4848.5, 4844.5, 4840.75, 4835.75, 4829.5, 4824.5, 4820.75, 4818.5, and 4812.75.
Crude Oil
OPEC has agreed to discuss limits on production, beginning in November. This sent oil well to the north of projections, but overnight retraced into the high I suggested for the day at 46.6. This will now be the new support region, and we’ll look to 47.92, as resistance. We hold bullish momentum, but in the grand scheme of things, I see this move as a temporary one, as several countries are in straits requiring them to keep production levels as high as they can to recover from lost exports.
Trading ranges for crude oil should hold between 46.5 and 47.98 in the current pattern. Traders are skittish, so be very careful on the edges of these formations, as they could continue swiftly in the direction of motion.
Upside trades can be staged on the positive retest of 47.09, or at a positive retest off 46.6 with positive momentum. I often use the 30min to 1hr chart for the breach and retest mechanic. Targets from 46.6 are 46.89, 47.04, 47.23, 47.35, 47.47, 47.61, 47.84 and 47.98. See the blog for more details on the chart action.
Downside trades can be staged on the failed retest of 46.5, or at the failed retest of 47.17 with negative divergence. Targets from 47.17 are 46.98, 46.71, 46.6, 46.42, and 46.27 t0 46.05.
If you’re interested in the live trading room, it is now primarily stock market futures content, though we do track heavily traded stocks and their likely daily trajectories as well – we begin at 9am with a morning report and likely chart movements along with trade setups for the day.
As long as the trader keeps himself aware of support and resistance levels, risk can be very adequately managed to play in either direction as bottom picking remains a behavior pattern that is developing with value buyers and speculative traders.
Twitter: @AnneMarieTrades
The author trades stock market futures every day and may have a position in mentioned securities at the time of publication. Any opinions expressed herein are solely those of the author, and do not in any way represent the views or opinions of any other person or entity.


