Stock Market Outlook for October 26, 2016 –
Price resistance for S&P 500 futures continues to hold at 2151. Trading patterns are holding steady for the second day and, though lower, the range bound activity is likely to continue. The S&P 500 (INDEXSP:.INX) is trading below levels that show strong buying pressure. Muted power from buyers may send us lower due to a lack of buying pressure. That said, I still suspect that our range tightens into the election. Price support on S&P 500 futures has moved lower and is back near 2123-2126.
See today’s economic calendar with a rundown of releases.
TODAY’S RANGE OF MOTION
S&P 500 Futures Trading Outlook Chart – October 26
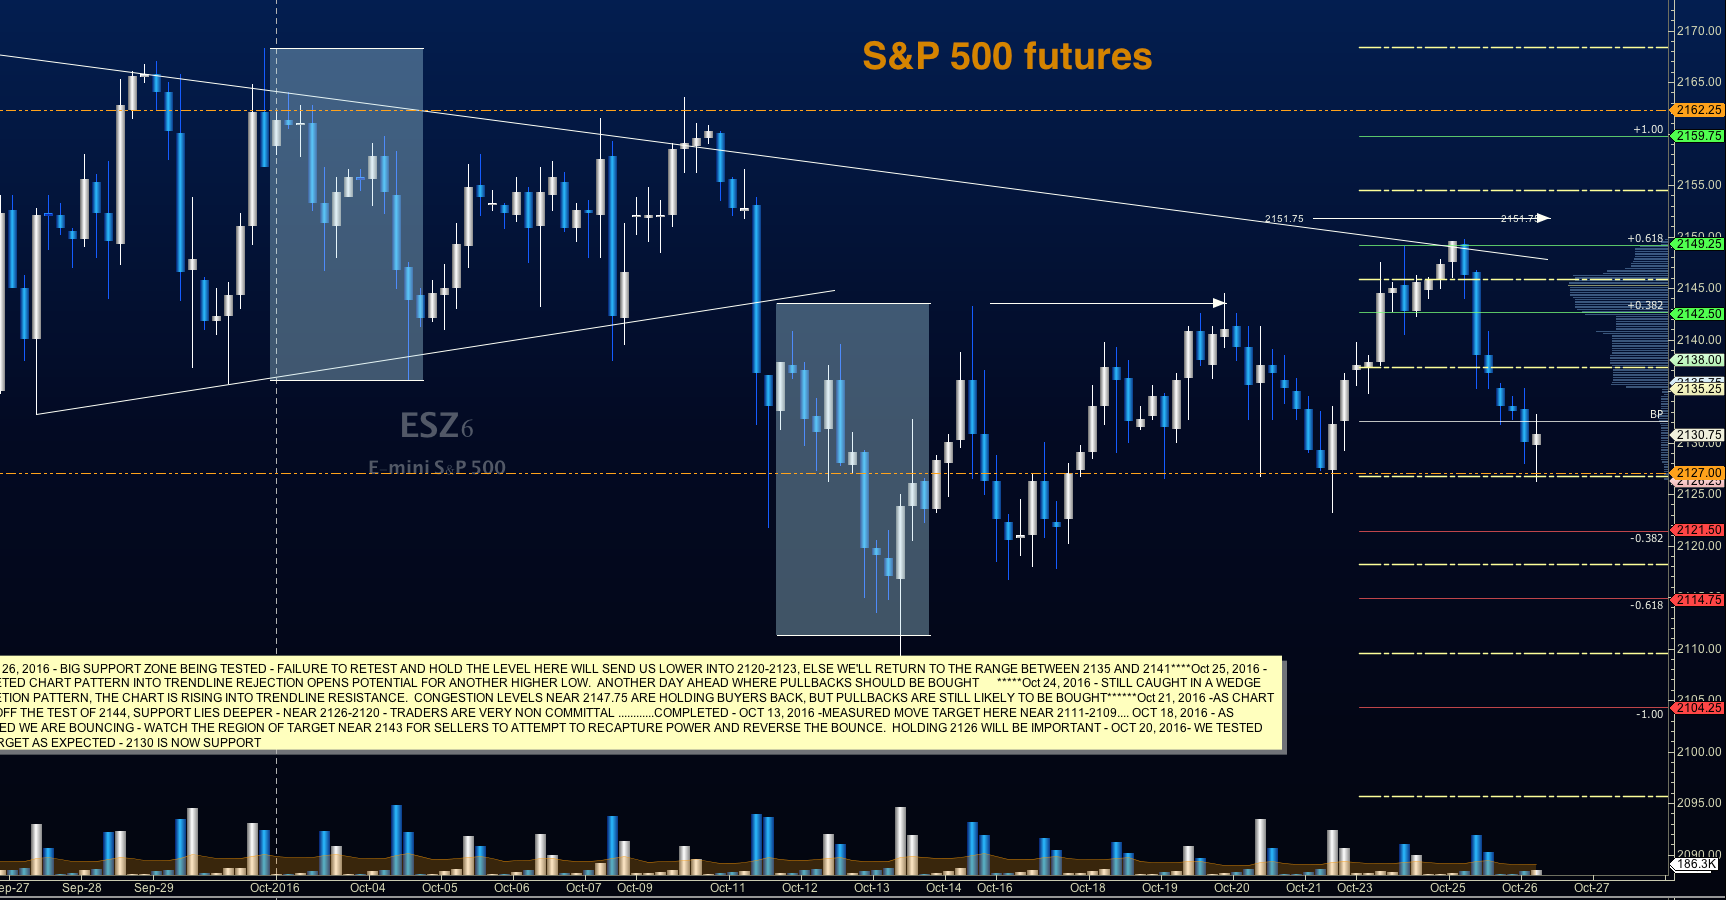
Upside trades on S&P 500 futures – Favorable setups sit on the positive retest of 2131.75, or a positive retest of the bounce off 2126.5 with upward momentum. I use the 30min to 1hr chart for the breach and retest mechanic. Targets from 2126.5 are 2131.5, 2136.5, 2140.5, 2143.5, 2145.75, 2147.25, 2149.5, 2152, and 2156.5. As always, additional targets will be in the Members only portion of the morning blog.
Downside trades on S&P 500 futures – Favorable setups sit below the failed retest of 2123.5, or at the failed retest of 2136.5(watch for the higher low if this is attempted) with negative divergence. Retracements into lower levels from 2136.5 give us the targets of 2134, 2131.75, 2127.5, 2126.25, 2123.5, and 2120.25. Additional targets will be in the Members only portion of the morning blog, and in the live trading room.
Nasdaq Futures
The NQ_F drifted lower overnight with the weight of AAPL, I imagine yesterday and continued to run lower into overnight trading hours. New resistance areas are much lower – 4876 to 4884. Today’s support is also lower – in the region between 4840 and 4854.
Upside trades on Nasdaq futures – Favorable setups sit on the positive retest of 4875.75, or a positive retest of 4854.75 with positive momentum. I use the 30min to 1hr chart for the breach and retest mechanic. Targets from 4854.75 are 4862, 4866.25, 4871, 4875.5, 4879.25, 4882.5, 4887, 4889.75, 4894.25, 4898.25, 4902.25, 4907.5, 4912.25, and 4919.5. As always, additional targets will be in the Members only portion of the morning blog, and in the live trading room.
Downside trades on Nasdaq futures – Favorable setups sit below the failed retest of 4853 (needs negative momentum here for continuation), or at the failed retest of 4872 with negative divergence. Retracements into lower levels from 4872 are 4870.5, 4866.25, 4862.25, 4856.75, 4853, 4849, and 4844.5. See the blog for additional targets.
Crude Oil
API inventories and continued bearish news pressed oil lower overnight and into the early morning. Our support level of 49.02 is close to being broken, but traders are trying to lift the area. The sentiment is now a bit negative – so the battle to be won is right here at 49. Big spikes in either direction will likely drift back into the region between 49.6 and 52.42 for the week.
Trading ranges for crude oil have expanded- 48.11 and 52.42 in the current pattern.
Upside trades on crude oil can be staged on the positive retest of 49.68, or at a positive retest off 49.02 with positive momentum. I often use the 30min to 1hr chart for the breach and retest mechanic. Targets from 49.02 are 49.55, 49.88, 50.46, 50.84, 50.96, 51.09, 51.36, 51.65, 51.82, 52.02, and 52.24 to 52.42. See the blog for more details on the chart action.
Downside trades on crude oil can be staged on the failed retest of 49, or at the failed retest of 50.13 with negative divergence. Targets from 50.13 are 49.96, 49.68, 49.61, 49.33, 49.11, 49.02, 48.69, and 48.34. Additional targets will be in the Members only portion of the morning blog, and in the live trading room.
Visit TheTradingBook.com for more information.
If you’re interested in the live trading room, it is now primarily stock market futures content, though we do track heavily traded stocks and their likely daily trajectories as well – we begin at 9am with a morning report and likely chart movements along with trade setups for the day.
As long as the trader keeps himself aware of support and resistance levels, risk can be very adequately managed to play in either direction as bottom picking remains a behavior pattern that is developing with value buyers and speculative traders.
Twitter: @AnneMarieTrades
The author trades stock market futures every day and may have a position in mentioned securities at the time of publication. Any opinions expressed herein are solely those of the author, and do not in any way represent the views or opinions of any other person or entity.

 Rolling Over At Key Fibonacci Level?")


