S&P 500 Futures June 29 – Trading Outlook (ES_F) – S&P 500 futures are continuing to bounce higher on Wednesday. If we can overtake 2043.5 to 2045.25 and hold, then we’ll likely stair step right back into 2064 to 2067.
Deeper support sits at 2025-2028. This would mark another region of higher lows for S&P 500 futures. We continue to recover from the hefty fade on the British EU referendum vote. Momentum today is suggesting that we find buyers on stock market futures pullbacks into support areas (see S&P 500 and Nasdaq futures trading outlooks below). Because the auction spaces upward look a bit thin, we should see a bit of a drift into support. That said, the bullish undercurrent is quite similar to yesterday’s, except for the fact that we are heading into a primary resistance area.
See today’s economic calendar with a rundown of releases.
RANGE OF TODAY’S MOTION
E-mini S&P Futures
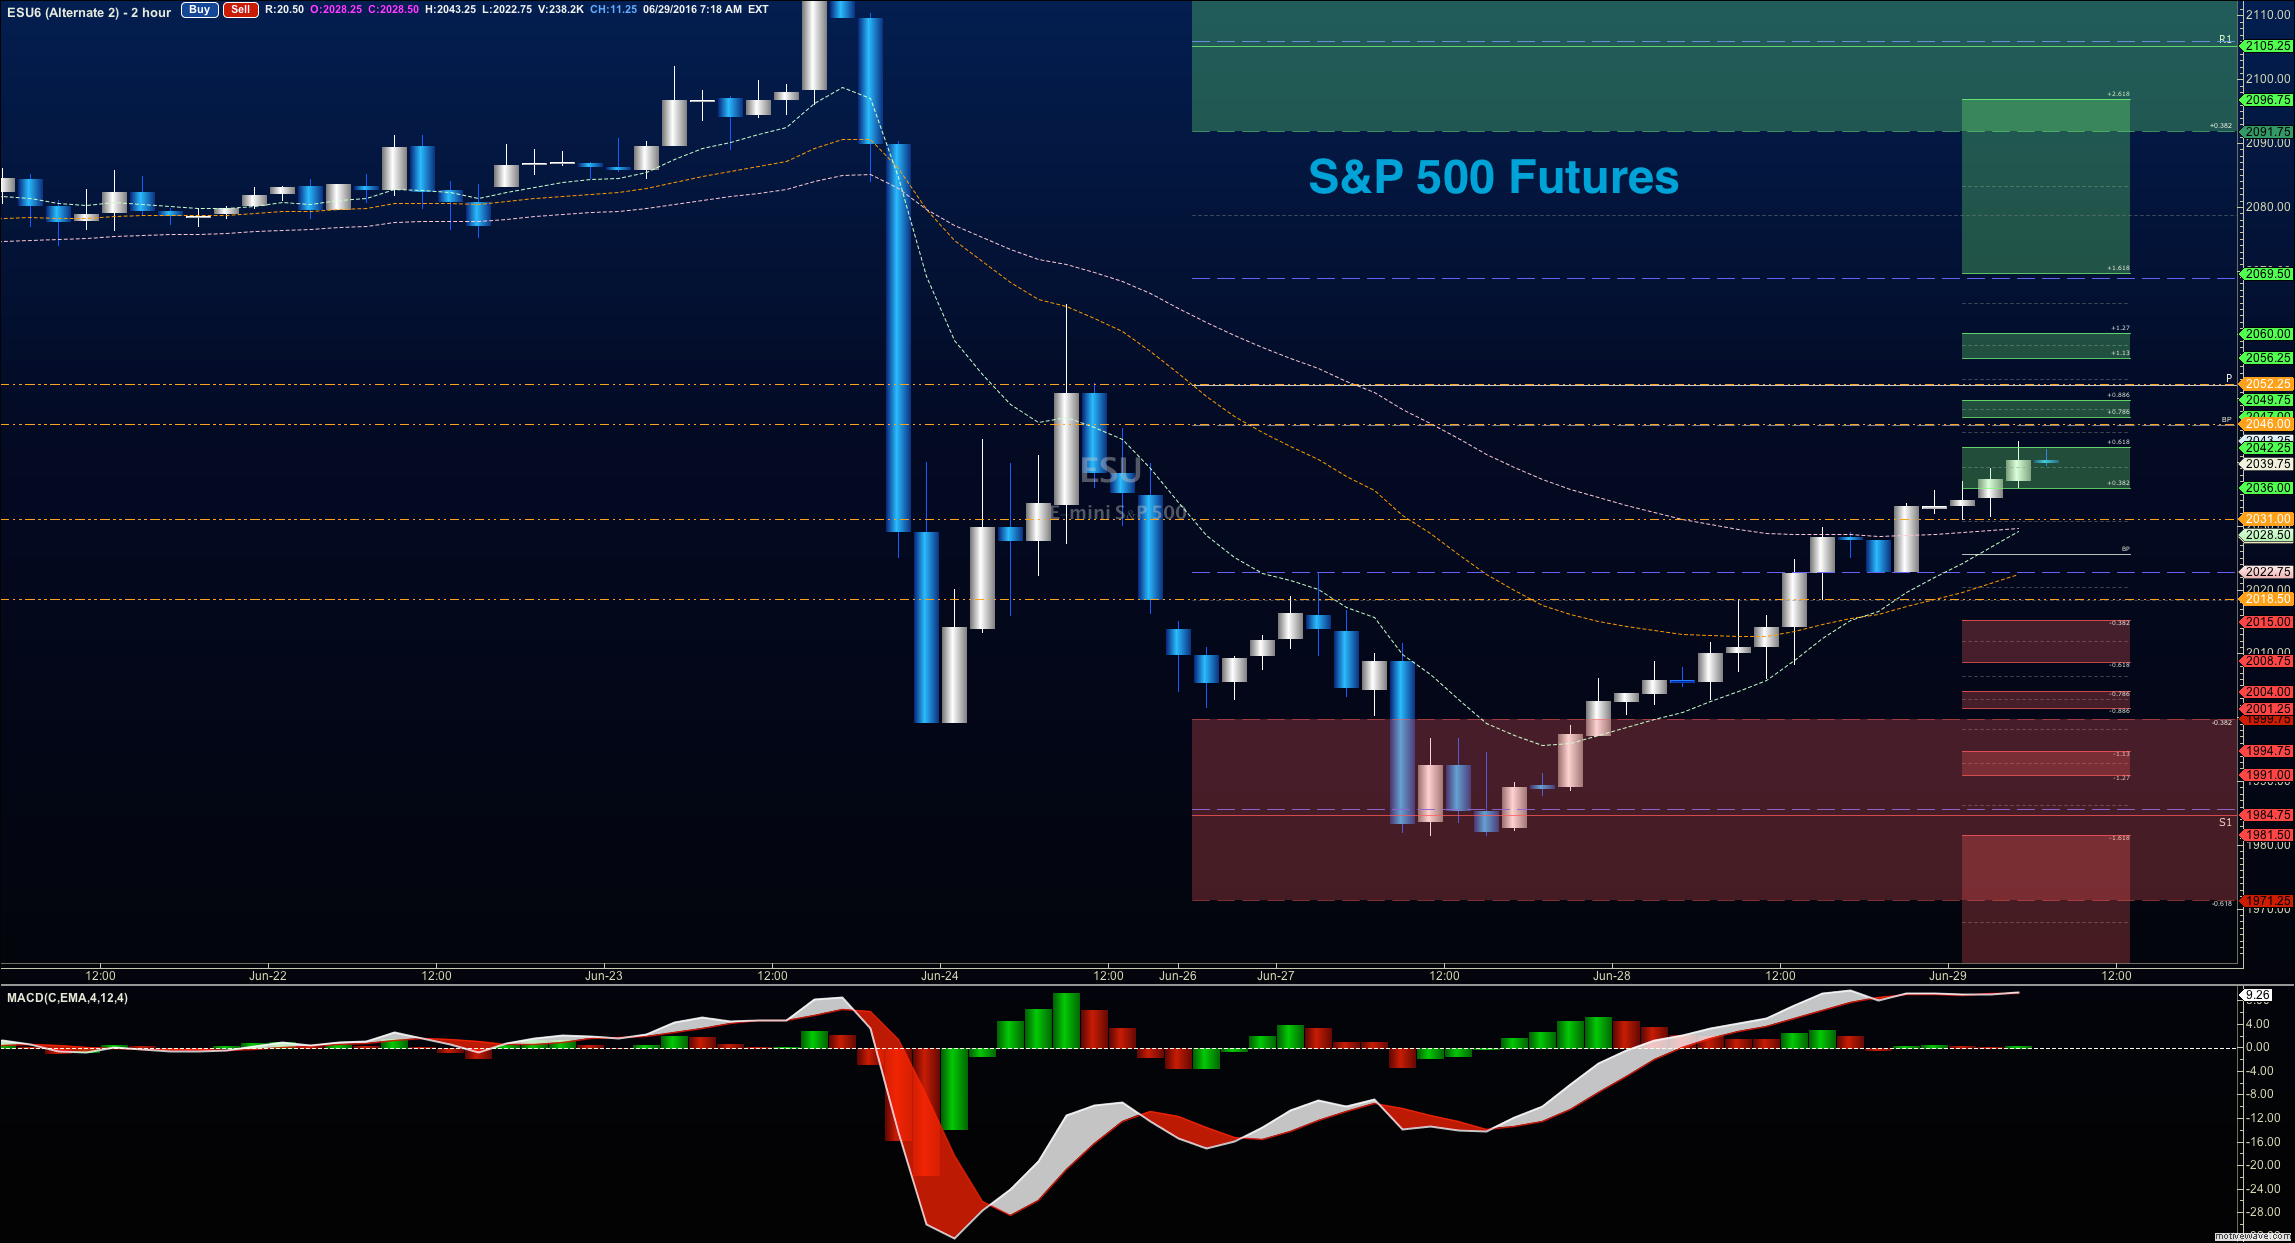
S&P 500 Futures June 29 Trading Outlook (ES_F) –
Upside trades on S&P 500 futures – Favorable setups sit on the positive retest of 2036.25, or a positive retest of the bounce off 2022.75 with positive momentum. Be very careful watching for sellers showing up near 2036, with the entry near 2022.75, as failure there could signal that we will return to lower levels. I use the 30min to 1hr chart for the breach and retest mechanic. Targets from 2022.75 are 2025, 2027.5, 2031.25, 2033.25, 2036.5, 2039, 2043.25, 2046, 2051.5, 2053.75, 2056.75, 2060.5, 2064, and 2066.75.
Downside trades on S&P 500 futures – Favorable setups sit below the failed retest of 2035.5 or at the failed retest of 2042.75 with negative divergence. It is important to watch for higher lows to develop with the 2042.75 entry, as the chart may be attempting recovery under the current bullish environment. Retracement into lower levels from 2042.75 gives us the targets 2039, 2036.5, 2032.5, 2028.25, 2022.75, 2018.25, 2013.75, 2011.75, 2008.25, 2005.75, 2002.75, 1999.5; and if sellers catch hold, 1991.75, 1987.5, 1984.75, 1981.75.
Have a look at the Fibonacci levels marked in the blog for more targets.
Nasdaq Futures
Trading Outlook Nasdaq Futures for June 29, 2016 (NQ_F) – Nasdaq futures followed the ES_F and is also sitting at resistance of prior days. Resistance today now sits for now at 4329.5, then 4343. As long as we observe candlesticks giving us higher lows on hourly frames, we can see the likelihood of a continued press forward. Support is near 4281, and if sellers press further, deeper support lies near 4252.
Upside trades on Nasdaq futures – Favorable setups sit on the positive retest of 4298, or a positive retest of 4281.5 with positive momentum. I use the 30min to 1hr chart for the breach and retest mechanic. Watch for the lower high to develop in the long opening at 4281.5, if sellers take over intraday. Targets from 4281.5 are 4298, 4306.25, 4311.25, 4315.5, 4320.25, 4322.75, 4330.25, and 4337.25.
Downside trades on Nasdaq futures – Favorable setups sit below the failed retest of 4298 or at the failed retest of 4309.5 with negative divergence. Retracement into lower levels from 4309.5 gives us the targets 4298.5, 4295.25, 4288.5, 4283.25, 4274.5, 4268.25, 4257.5, 4253.25, 4243.5, 4227.5, 4224.5, 4222, 4218.25, 4213.5, 4186.5, 4175.5, 4170.5, and 4167.5, if sellers accelerate the process.
Crude Oil
Trading Outlook for Crude Oil for June 29 (CL_F) – The API report yesterday showed another draw, and greater than expected. EIA report is today at 10:30am. Oil sits right off the edge of resistance near 48.47, after holding a bounce on the news of the draw in inventories.
The trading range on crude oil futures shows support action near 47.2, and resistance behavior near 48.77. A big number on the EIA could propel us over the edges noted, and range expansion in either direction is possible.
Upside trades on crude oil futures can be staged on the positive retest of 48.08, or at a bounce off 47.74 with positive momentum. I often use the 30min to 1hr chart for the breach and retest mechanic. Targets from 47.74 are 47.94, 48.16, 48.43, 48.6, 48.8, and 49.04. Range expansions on surprise movement could extend to 49.47 to 49.74.
Downside trades on crude oil futures can be staged on the failed retest of 47.98, or at the failed retest of 48.77 with negative divergence. These setups give us targets from 48.77 into 48.57, 48.47, 48.29, 47.98, 47.74, 47.48, 47.13, 46.89, 46.7, 46.44, and perhaps 46.27 to 45.87.
If you’re interested in the live trading room, it is now primarily stock market futures content, though we do track heavily traded stocks and their likely daily trajectories as well – we begin at 9am with a morning report and likely chart movements along with trade setups for the day.
As long as the trader keeps himself aware of support and resistance levels, risk can be very adequately managed to play in either direction as bottom picking remains a behavior pattern that is developing with value buyers and speculative traders.
Twitter: @AnneMarieTrades
The author trades stock market futures every day and may have a position in mentioned securities at the time of publication. Any opinions expressed herein are solely those of the author, and do not in any way represent the views or opinions of any other person or entity.


")
 Ready To Break Out?")

 Rolling Over At Key Fibonacci Level?")
