S&P 500 Trading Outlook for June 20, 2016 (ES_F) – S&P 500 futures continue to bounce showing higher lows, and a push to resistance. Traders have settled into a presumed failure of the EU referendum for Britain leaving on Thursday.
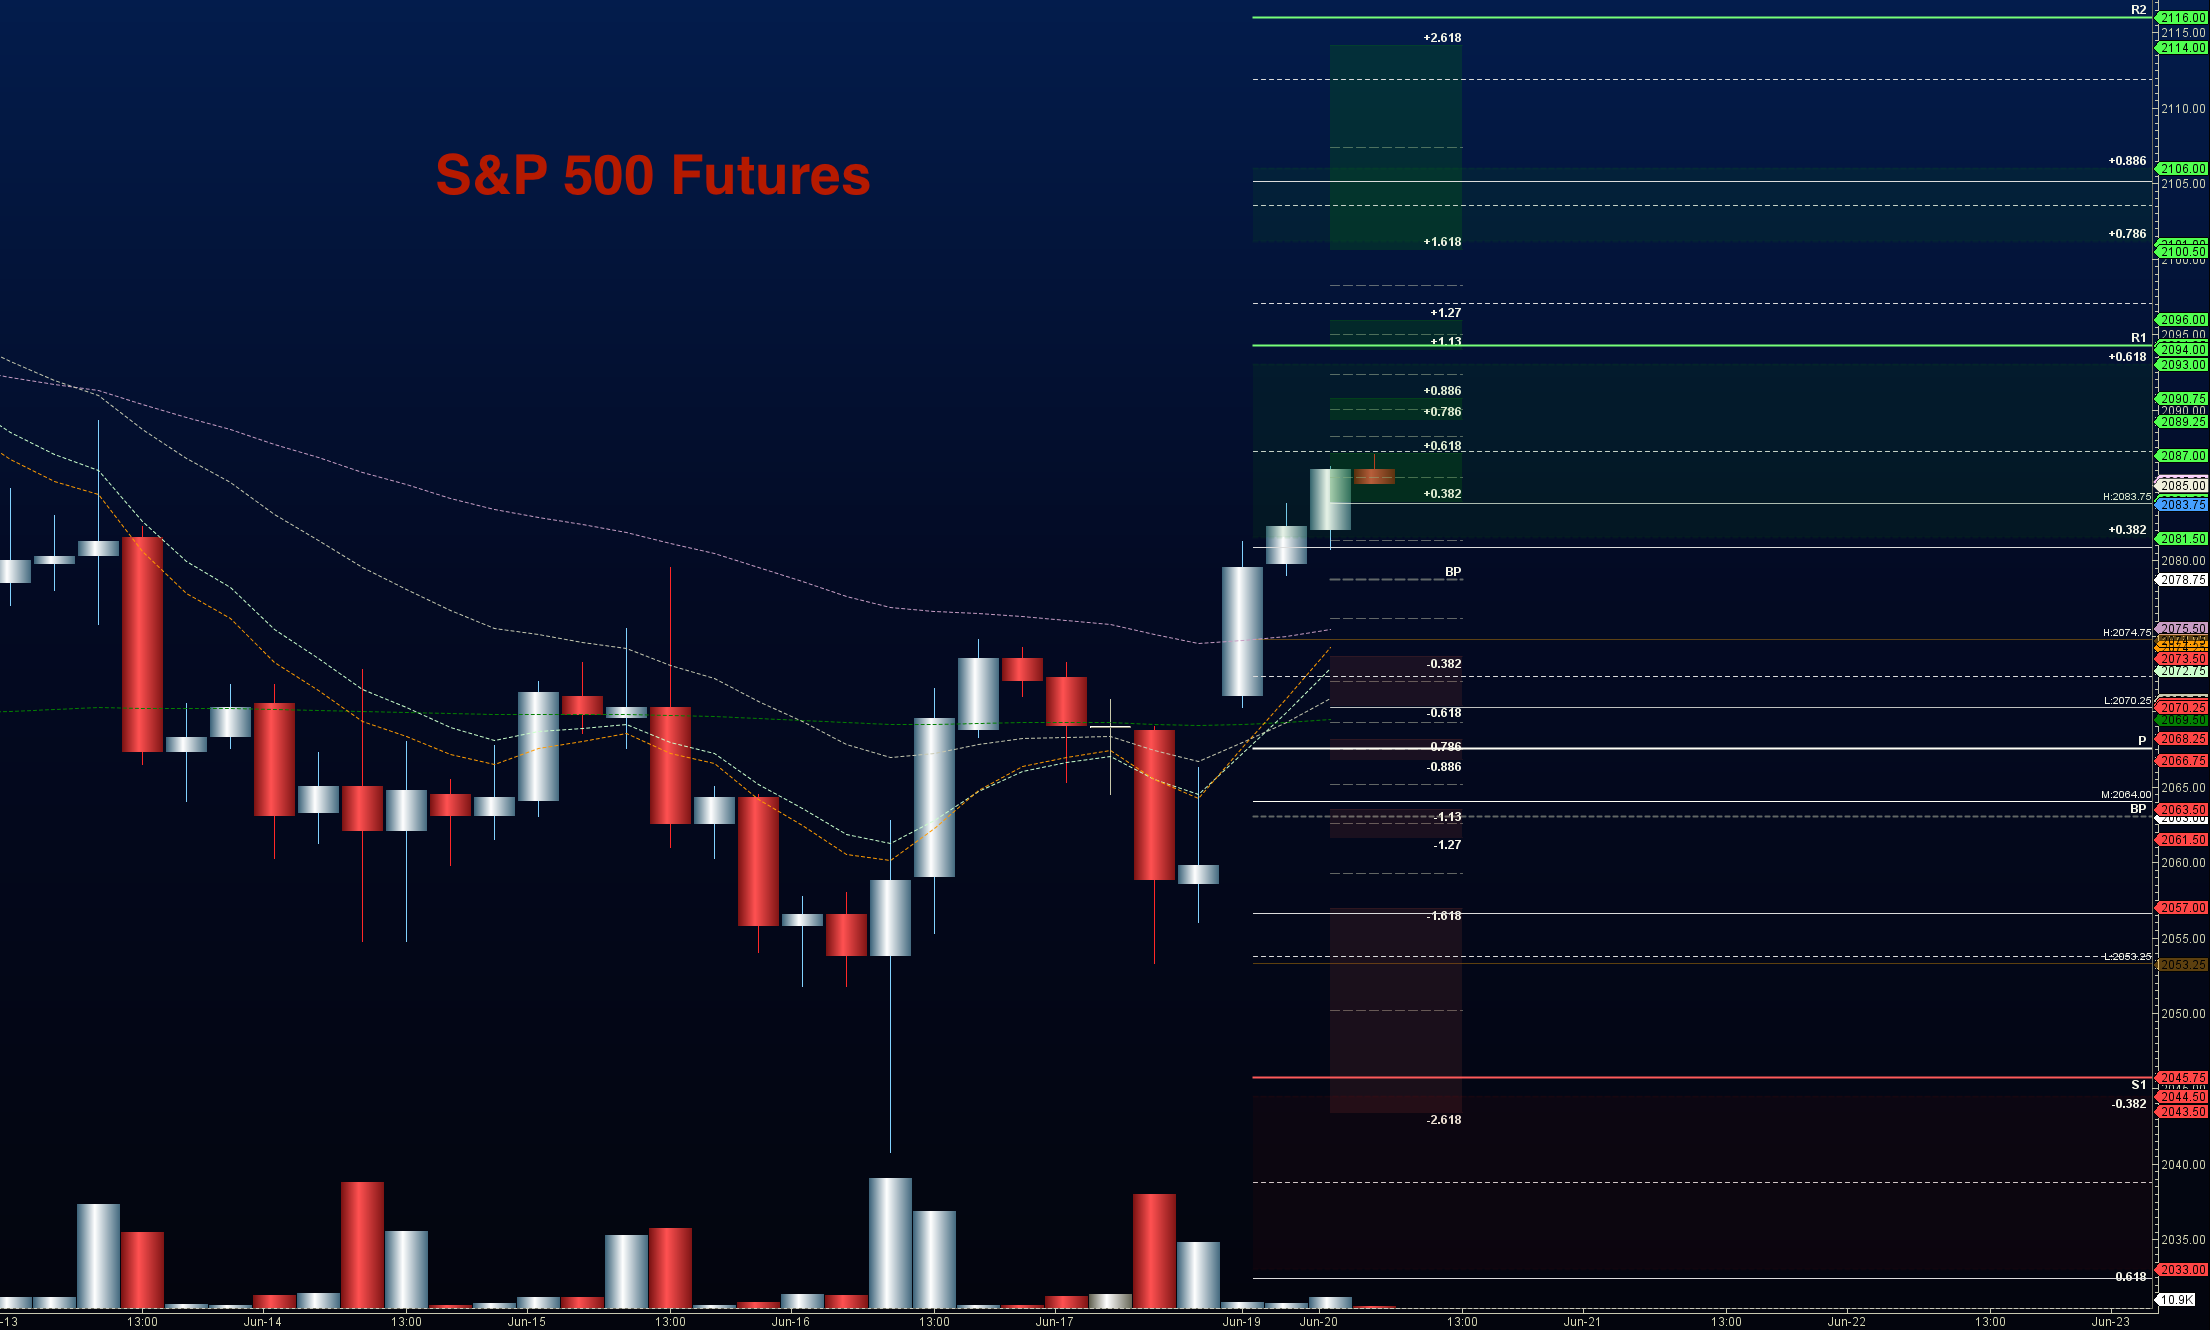
Volatility should be high this week, particularly currencies. Support levels look like the 2059.75 region after the gap up Sunday night into 2070.25. S&P 500 futures resistance sits near 2086 to 2094.5. Bullish formations are now in charge at this time, but charts still look fragile. As for today’s trading outlook, I suspect that breakouts will certainly come back to retest areas of support. When in doubt, consider your trend, and trade with the trend
See today’s economic calendar with a rundown of releases.
RANGE OF TODAY’S MOTION
E-mini S&P Futures
S&P 500 Trading Outlook for June 20
Upside trades on S&P 500 futures – Favorable setups sit on the positive retest of 2084.25, or a positive retest of 2076.25 with positive momentum. I use the 30min to 1hr chart for the breach and retest mechanic. Targets from 2076.25 are 2078.75, 2081.5, 2084, 2086.25, 2088.25, 2093.5, 2095.75, and perhaps 2098.25, and 2099.75 to 2104.5, if power remains with the buyers. We are sitting at another near term resistance area of 2086.5. Selling pressing will likely accelerate below 2069, if it does not quickly recover off the test of the levels near 2070.5.
Downside trades on S&P 500 futures – Favorable setups sit below the failed retest of 2077.75 or at the failed retest of 2092.25 with negative divergence. It is important to watch for higher lows to develop with the 2090.25 entry, as the chart may be attempting recovery. Retracement into lower levels from 2092.25 gives us the targets 2088.5, 2086, 2083.25, 2081.5, 2077.75, 2075.75, 2072.25, 2070.25, 2068.5, 2066.5, 2064, 2061.75, 2060.25, 2058.75, 2056.75, 2053.5, 2051.5, 2047.5, and perhaps back to 2046.25, and 2041.5 – but that seems very unlikely at this time. Markets are sure to fall for a bit if the EU vote is unexpected- but that vote does not come until Thursday. Expect to see signs of hedging as the week continues.
Have a look at the Fibonacci levels marked in the blog for more targets.
Nasdaq Futures
Trading outlook for Nasdaq futures for June 20, 2016 (NQ_F). Nasdaq futures have followed the bounce in S&P 500 futures nicely and a move into major averages above. Bounces are likely to hold off support as buyers hold steady and bring higher lows. Resistance looks like 4455 to 4478
Upside trades on Nasdaq futures – Favorable setups sit on the positive retest of 4423.25, or a positive retest of 4405.25 with positive momentum. I use the 30min to 1hr chart for the breach and retest mechanic. Watch for the lower high to develop in the long opening at 4405.25, as momentum may shift to sellers with the dip lower. Targets from 4405.25 are 4409.75, 4412.25, 4415.5, 4420.5, 4424.5, 4429.75, 4434.25, 4438.5, 4443.25, 4449.25, and 4454.5. Range expansions above 4454.5 could push us into 4476-4478.
Downside trades on Nasdaq futures – Favorable setups sit below the failed retest of 4404.25 or at the failed retest of 4440.75 with negative divergence. Buyers continue to successfully stage bounces off higher lows to keep the move upward going. Retracement into lower levels from 4440.75 gives us the targets 4443.25, 4438.5, 4434.25, 4429.75, 4424.5, 4420.5, 4415.5, 4412.25, 4409.75, 4405.5, 4401.75, 4393.5, 4389.5, 4384.75, 4378.75, 4384, 4378.75, 4374, 4367.75, and perhaps 4364.5 – though unlikely today.
Crude Oil
Crude Oil futures trading outlook for June 16 (CL_F) – Nigerian oil disruptions continue to lift price in oil under uncertainty as we drift right back into the sideways congestion region between 47.7 and 50.45. Oil is caught close to frontline resistance near 49.56. We briefly dropped below 47.7 into 45.91, then began a swift rally to recover 48– a key region for many participants right now.
The trading range on crude oil suggests support action near 46.2, and resistance behavior near 50.54.
Upside trades on crude oil futures can be staged on the positive retest of 49.12, or at a bounce off 48.7 with positive momentum. I often use the 30min to 1hr chart for the breach and retest mechanic. Targets from 48.7 are 49.05, 49.24, 49.53, 49.74, 49.97, 50.11, 50.24, 50.45, 50.56, 50.71, 50.9, and possibly 51.12 to 51.47, if production continues to be disrupted, and traders take advantage of the move.
Downside trades on crude oil futures can be staged on the failed retest of 48.6, or at the failed retest of 49.56 with negative divergence. These setups give us targets from 49.56 into 49.26, 49.08, 48.94, 48.78, 48.64, 48.46, 48.24, 48.09, 47.97, 47.74, 47.48, 47.24, 46.89, 46.49, 46.24, 46.04, and perhaps 45.94 to 45.46.
Visit TheTradingBook.com for more information.
If you’re interested in the live trading room, it is now primarily stock market futures content, though we do track heavily traded stocks and their likely daily trajectories as well – we begin at 9am with a morning report and likely chart movements along with trade setups for the day.
As long as the trader keeps himself aware of support and resistance levels, risk can be very adequately managed to play in either direction as bottom picking remains a behavior pattern that is developing with value buyers and speculative traders.
Twitter: @AnneMarieTrades
The author trades stock market futures every day and may have a position in mentioned securities at the time of publication. Any opinions expressed herein are solely those of the author, and do not in any way represent the views or opinions of any other person or entity.

 Rolling Over At Key Fibonacci Level?")


