S&P 500 Futures Trading Outlook for June 13, 2016
Stock market futures are quiet into the beginning of an FOMC week and options expiration week for all the major classes of options. This environment usually sends us into at least one day of big volatility. And the EU referendum on Jun 23 for GB leaving the EU looms large in uncertainly. This is ending the bond and currencies into a bit of movement early, and that will certainly bleed over at some point into equities. Support on S&P 500 futures lies between 2077 and 2071.25 today. Resistance sits near 2089 to 2094. Bearish formations are in charge at this time, but we are sitting at near term support.
See today’s economic calendar with a rundown of releases.
RANGE OF TODAY’S MOTION
E-mini S&P Futures Trading Outlook Chart
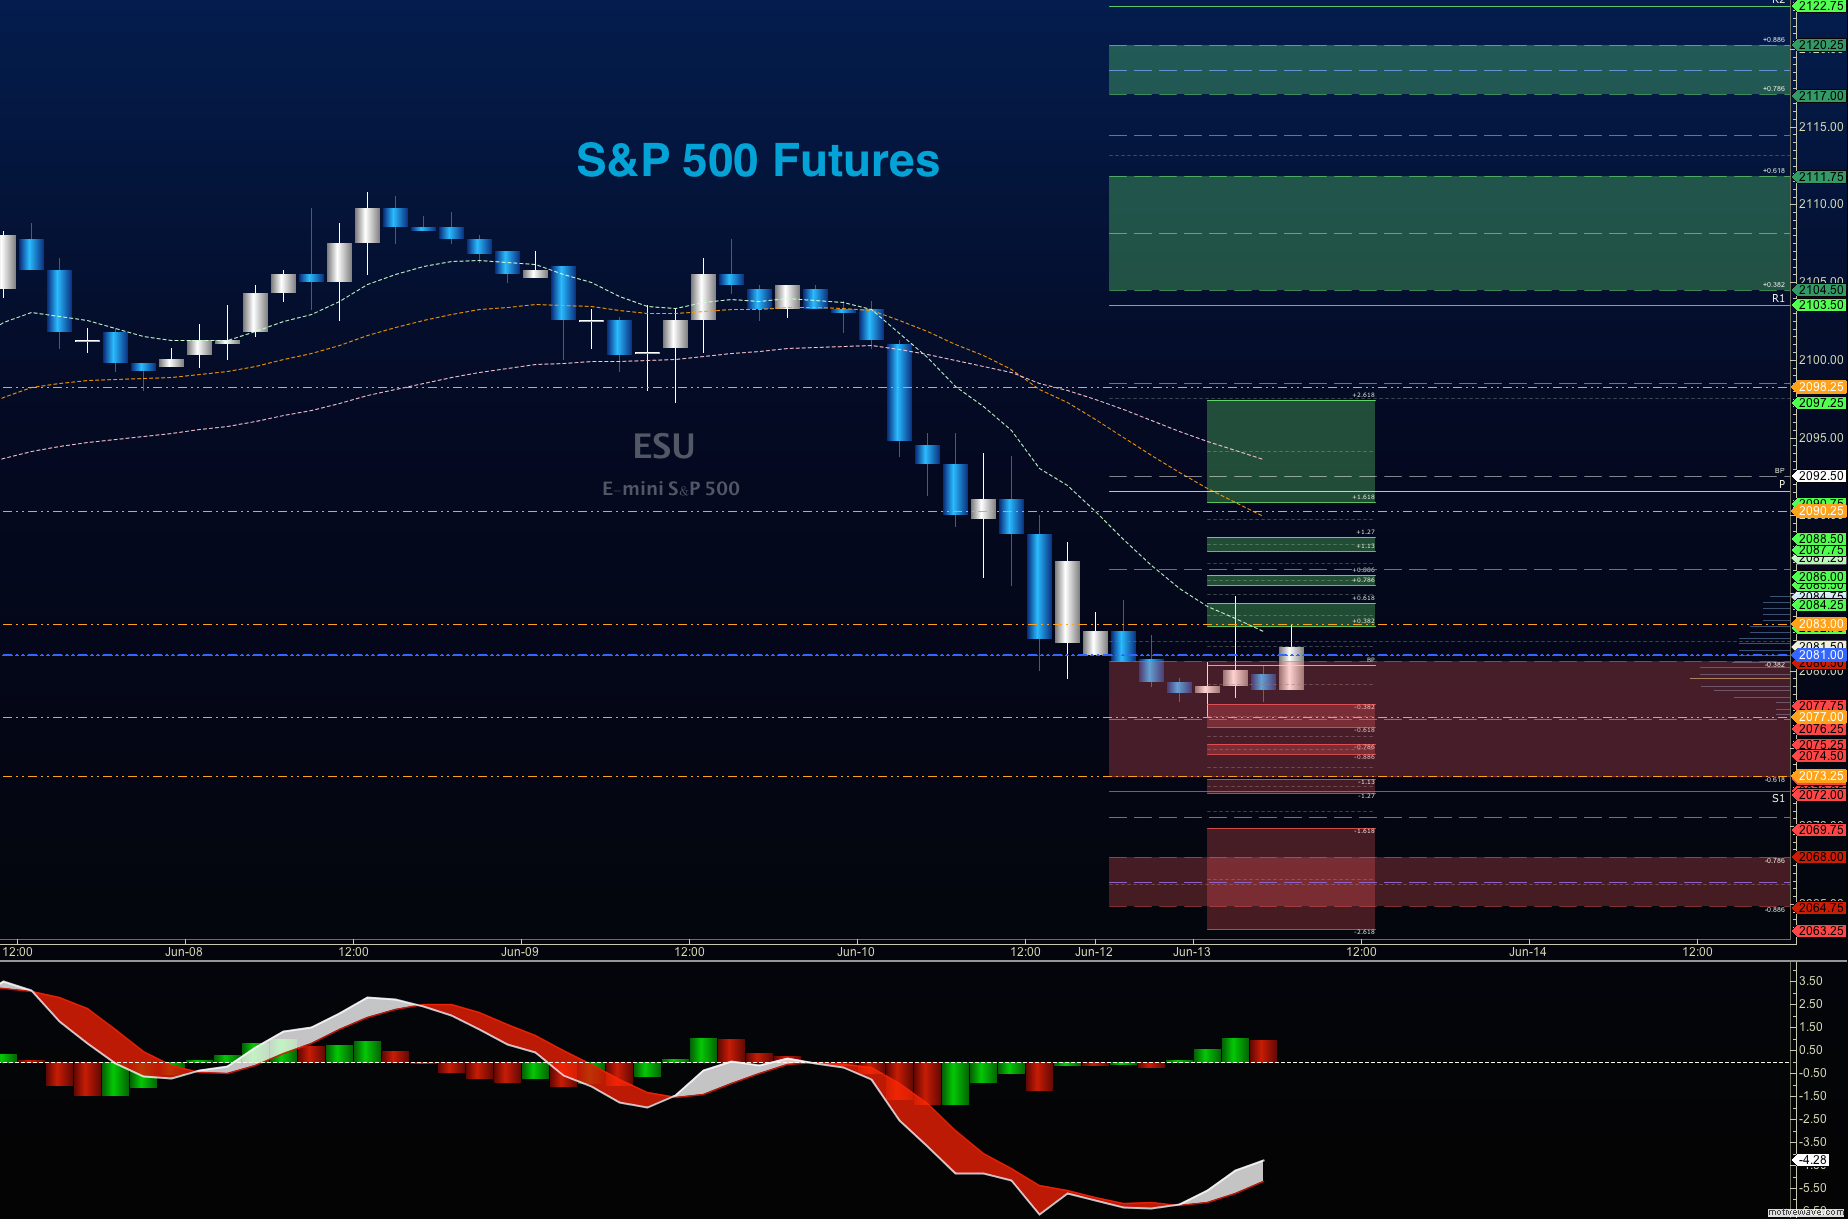
S&P 500 Futures Trading Outlook for June 13, 2016 –
Upside trades on S&P 500 futures – Favorable setups sit on the positive retest of 2086.75, or a positive retest of 2078.5 with positive momentum. I use the 30min to 1hr chart for the breach and retest mechanic. Targets from 2078.5 are 2081.5, 2084.75, 2086.75, 2090.5, 2093.5, 2095.75, 2097.25, 2099.5, 2102.25, and perhaps 2107.5, and 2112.25, if power shifts to the buyers. Seeing continued negative momentum, but we are sitting a near term support area of 2077.75. Selling pressing will accelerate below 2071.5
Downside trades on S&P 500 futures – Favorable setups sit below the failed retest of 2089.5 or at the failed retest of 2089.25 with negative divergence. It is important to watch for higher lows to develop with the 2089.25 entry, as the chart may be attempting recovery. Retracement into lower levels from 2089.25 gives us the targets 2088, 2086.25, 2082.5, 2077.5, 2075.75, 2071.75 and perhaps back to 2068.5, and 2063.5.
Have a look at the Fibonacci levels marked in the blog for more targets.
Nasdaq Futures
Outlook for Nasdaq futures for June 13, 2016 – Nasdaq futures (NQ_F) sits at significant support this morning, but seems to be bounded above by strong resistance near 4455. If we can breach that, buyers will become brave and attempt to push price further upward. Momentum is still slanted to sellers, so bounces should fail at the first pass into resistance. I’ll be keeping a watchful eye out for the appearance of higher lows.
Upside trades on Nasdaq futures – Favorable setups sit on the positive retest of 4455.5, or a positive retest of 4427.75 with positive momentum. I use the 30min to 1hr chart for the breach and retest mechanic. Watch for the lower high to develop in the long opening at 4455.5, as momentum sits in favor of sellers this morning. Targets from 4427.75 are 4441.25, 4446.25, 4452, 4455.5, 4465.5, 4474.25, 4485.5, 4490.5, 4494.25, 4497.5, 4502.25, 4512.25, 4515.5, 4520.25, 4524.5, 4529.5, and 4534.25. Range expansions above 4502 are unlikely under the current momentum conditions.
Downside trades on Nasdaq futures – Favorable setups sit below the failed retest of 4427.5 or at the failed retest of 4469.75 with negative divergence. Retracement into lower levels from 4469.75 gives us the targets 4464.75, 4462.5, 4455.5, 4446.75, 4434.5, 4427.5, 4422.5, and perhaps 4412.5 . A review of Friday’s post shows that both the ES_F and the NQ_F came right into base targets set for the cycle.
Crude Oil
Crude Oil Outlook for June 13, 2016 -CL_F – As with both charts above, oil, too, sits in a sideways pattern near important support regions. Shale production has shifted up from news reports and BHI rig counts shifted up quickly, bringing more oil on line. We sit under negative momentum and bounces should be sold under these conditions.
The trading range on crude oil suggests support action near 47.24, and resistance behavior near 49.53.
Upside trades on crude oil can be staged on the retest of 48.9, or at a pullback into 48.62. I often use the 30min to 1hr chart for the breach and retest mechanic. Targets from 48.62 are 48.93 49.24, 49.43, 49.68, 49.98, and 50.12.
Downside trades on crude oil can be staged on the failed retest of 48.4, or at the failed retest of 48.85 with negative divergence. These setups give us targets from 48.85 into 48.7, 48.49, 48.27, 47.97, and perhaps 47.68 to 47.24.
If you’re interested in the live trading room, it is now primarily stock market futures content, though we do track heavily traded stocks and their likely daily trajectories as well – we begin at 9am with a morning report and likely chart movements along with trade setups for the day.
As long as the trader keeps himself aware of support and resistance levels, risk can be very adequately managed to play in either direction as bottom picking remains a behavior pattern that is developing with value buyers and speculative traders.
Twitter: @AnneMarieTrades
The author trades stock market futures every day and may have a position in mentioned securities at the time of publication. Any opinions expressed herein are solely those of the author, and do not in any way represent the views or opinions of any other person or entity.


 Ready To Break Out?")


 Ready To Break Out?")
