S&P 500 Futures July 29 – Trading Outlook Looking at the broader stock market using S&P 500 futures (ES_F) showed stocks jammed up in a trading range. But that could end soon as we enter the last trading day in July. We touched the top of our trading range again, but we’ll have to see if the stock market can break out.
The FOMC release yesterday did little to shake the charts from their congested levels. The S&P 500 Index (INDEXSP:.INX) and Futures market both sit in a tight range of congestion. S&P 500 futures, our focus, has followed the same pattern over the past several days. Initial price resistance is between 2172.5 and 2177.25, but we could breach into 2183.25, and even 2189.75 if there are lots of stops sitting above us, and we break out. Breaches should still fade back to higher breakout levels with momentum flat and near zero levels. Amazon and Google reported stronger than expected earnings and that spiked the Nasdaq for a bit, but the S&P 500 hasn’t followed with as much enthusiasm. Price support to watch below is 2151.5. That said, we did hold higher overnight lows near 2157.5. Buyers continue to have trouble getting past overhead supply, and sellers have been held at bay along support lines between 2151 and 2155. So we still wait for a break of the range. Traders will be impatient with a desire to see a break – I expect wicks on both ends before the real breach in either direction.
See today’s economic calendar with a rundown of releases.
RANGE OF TODAY’S MOTION
S&P 500 Futures July 29 Trading Chart (ES_F)
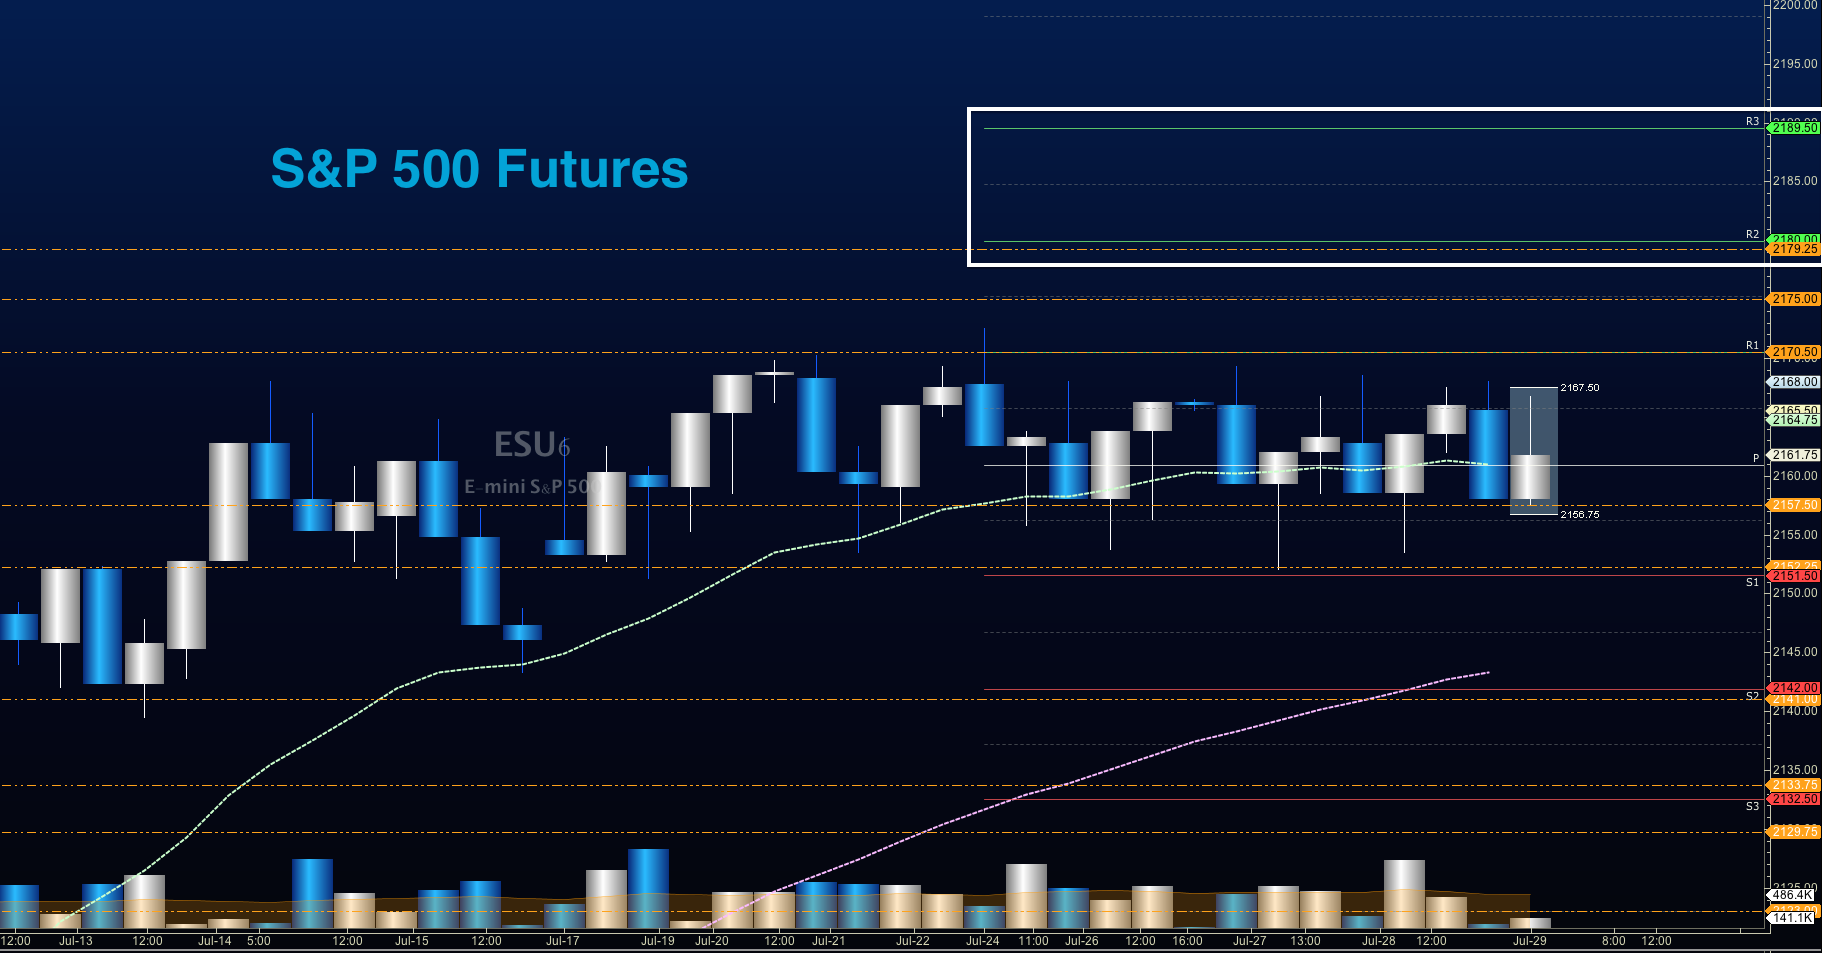
Upside trades on S&P 500 futures – Favorable setups sit on the positive retest of 2168.5, or a positive retest of the bounce off 2157.75 with positive momentum. Remember that the feel of the chart is congestion, so breakouts will be difficult to maintain. I use the 30min to 1hr chart as my breach and retest mechanic. Price targets from 2157.75 are 2161.5, 2163.25, 2165.5, 2166.5, 2171.25, 2175.75, 2177.25, 2179.25, and 2180.25. And if we expand, we may stretch higher into 2183.75 and 2189.75.
Downside trades on S&P 500 futures – Favorable setups sit below the failed retest of 2157 or at the first failed retest of 2165.5 with negative divergence. As this is still a relatively countertrend trade keep your eyes on the lookout for higher lows developing intraday. Retracement into lower levels from 2165.5 gives us the targets 2163, 2061.5, 2158.25, 2155.75, 2153.5, 2149.75, 2145.75, 2143, 2141.75, and 2138.75. And if seller take over, 2136.75 to 2128.25.
If you’re interested in watching these trades go live, join us in the live trading room from 9am to 11:30am each trading day.
Nasdaq Futures
The NQ_F spiked higher after the close yesterday with the reporting of Amazon and Google, breaching the 4727 target overnight. Hoever, it has since retraced into congestion near 4719.25. New support rests near 4690-4696, with a lower break into 4674-4678, if sellers gain traction. Resistance levels are now between 4727-4739. Expansions beyond there look like 4760.5 and 4790.5. Breaches should retest before any real expansion holds (as the chart did last night).
Upside trades on Nasdaq futures – Favorable setups sit on the positive retest of 4722.75, or a positive retest of 4712.5 with positive momentum. I use the 30min to 1hr chart as my breach and retest mechanic. Watch for the lower high to develop with this range break, if sellers exercise more power intraday. Price targets from 4712.5 are 4714.25, 4717.75, 4721, 4722.75, 4727.75, and 4733.5. And 4739.5, should buyers continue to support the rally.
Downside trades on Nasdaq futures – Favorable setups sit below the failed retest of 4707.5, or at the failed retest of 4722.75 with negative divergence. Retracement into lower levels from 4722.75 gives us the targets 4717.75, 4712.75, 4708.5, 4705.75, 4703, 4698.75, 4693.75, 4691.25, 4687.75, 4682.75, 4678.5, 4664.75, 4660.25, 4658.5, 4655.25, 4651.75, and 4645.5 to 4642.5, if sellers resume control.
Crude Oil
Traders continue to sell WTI Crude oil down, and lost another significant support level near 40.70, before a bounce holding just above it now. There is a lower level test near 40.46 – if buyers cannot assume control here, and an unlikely test of 39.85 below there.
Trading ranges in crude oil should hover between 40.14 and 42.26.
Upside trades in crude oil can be staged on the positive retest of 41.24, or at a bounce off 40.65 with positive momentum. I often use the 30min to 1hr chart for the breach and retest mechanic. Targets from 40.65 are 40.89, 41.12, 41.43, 41.67, 41.96, 42.16, 42.29, 42.45, 42.78, 42.97, 43.18, 43.3, 43.47, 43.68, 43.83, 44.02, 44.22, 44.49, and perhaps, 44.71, if buyers really take control.
Downside trades in crude oil can be staged on the failed retest of 40.6, or at the failed retest of 41.11 with negative divergence. Targets from 41.12 are 40.94, 40.73, 40.54, 40.39, 40.14, and perhaps 39.85.
If you’re interested in the live trading room, it is now primarily futures content, though we do track heavily traded stocks and their likely daily trajectories as well – we begin at 9am with a morning report and likely chart movements along with trade setups for the day.
As long as the trader keeps himself aware of support and resistance levels, risk can be very adequately managed to play in either direction as bottom picking remains a behavior pattern that is developing with value buyers and speculative traders.
If you’re interested in watching these trades go live, join us in the live trading room from 9am to 11:30am each trading day. It is now primarily stock market futures trading content, though we do track heavily traded stocks and their likely daily trajectories as well – we begin at 9am with a morning report and likely chart movements along with trade setups for the day. Visit TheTradingBook.com for more information.
As long as the trader keeps himself aware of support and resistance levels, risk can be very adequately managed to play in either direction as bottom picking remains a behavior pattern that is developing with value buyers and speculative traders.
Twitter: @AnneMarieTrades
The author trades stock market futures every day and may have a position in mentioned securities at the time of publication. Any opinions expressed herein are solely those of the author, and do not in any way represent the views or opinions of any other person or entity.


