S&P 500 Futures Trading Outlook for July 26, 2016 – Broad stock market formations appear to be in a wait and see state of some kind with consolidation being the order of the day. We are entering our 7th day testing the 2159 area. There will be a break of some magnitude once we resolve, but the direction of the break seems a bit cloaked. Either way, the S&P 500 (INDEXSP:.INX) may be readying for a bigger move.
We currently sit in congestion between 2159 and 2166 with mildly bullish momentum. S&P 500 futures price resistance is between 2171.5 and 2177.25 for today. Breaches should fade back to congestion regions as momentum continues to fade, though still positive. Price support to watch below is 2158, with the overnight low at 2158.25. Below that, we see 2155.75 and 2151.5 nearby. Buyers continue to have trouble getting past overhead supply, and moving averages are flattening.
See today’s economic calendar with a rundown of releases.
RANGE OF TODAY’S MOTION
S&P 500 Futures Trading For July 26 – ES_F Chart
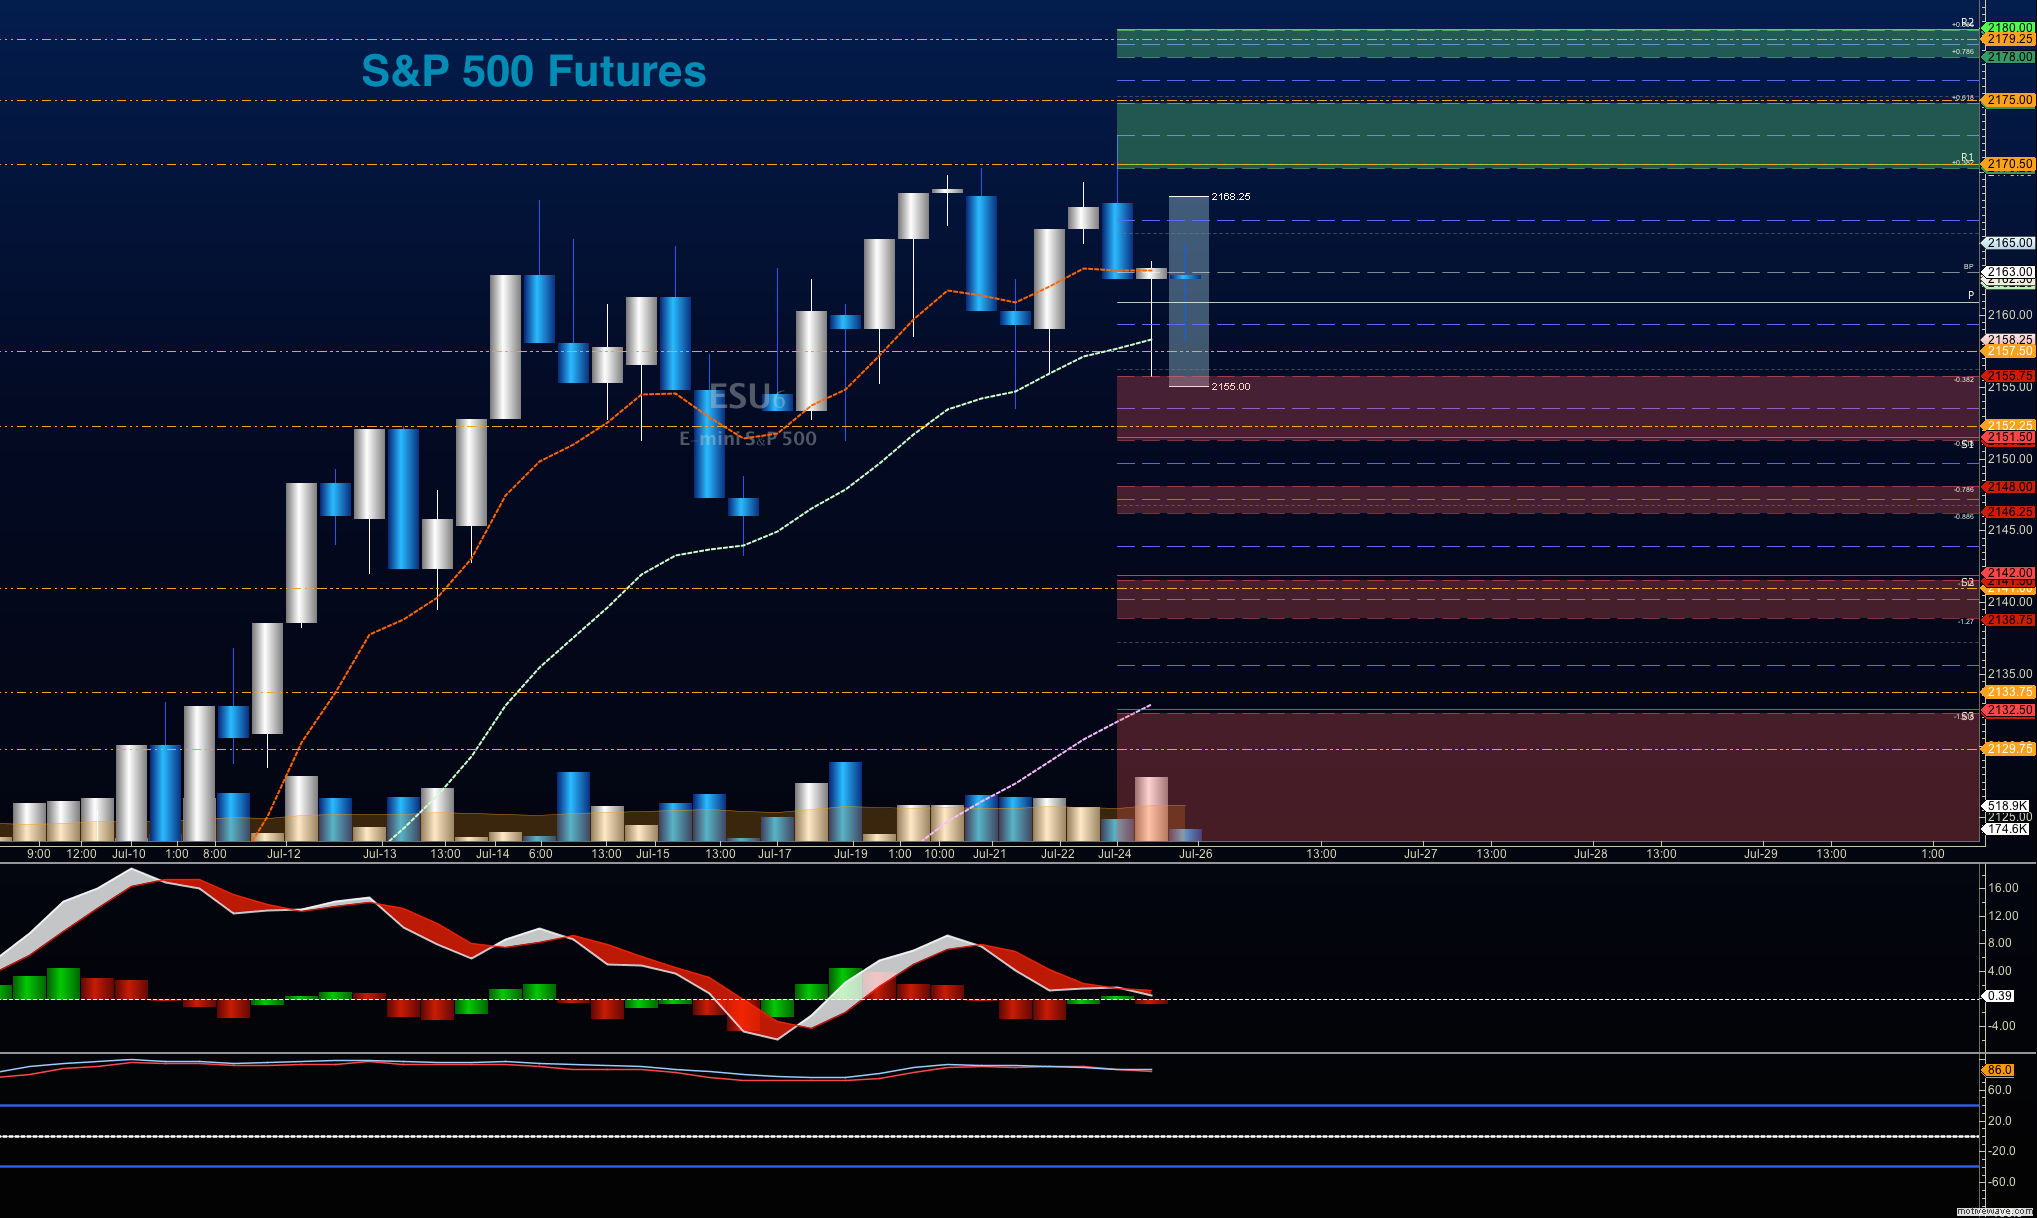
Upside trades on S&P 500 futures – Favorable setups sit on the positive retest of 2164.5, or a positive retest of the bounce off 2158.5with positive momentum. Remember that the feel of the chart is congestion, so breakouts will be difficult to maintain. I use the 30min to 1hr chart for the breach and retest mechanic. Targets from 2158.5 are 2161.5, 2164.5, 2167.75, 2171.25, 2175.75, 2177.25, 2179.25, and if we expand, we may stretch above into 2181.75.
Downside trades on S&P 500 futures – Favorable setups sit below the failed retest of 2158.25 or at the first failed retest of 2165.75 with negative divergence. As this is still a relatively countertrend trade keep your eyes on the lookout for higher lows developing intraday. Retracement into lower levels from 2165.75 gives us the targets 2163.5, 2060.75, 2158.25, 2156, 2153.5, 2149.75, 2145.75, 2143, 2141.75, 2138.75, and 2136.75 to 2128.25, if sellers take over.
Nasdaq Futures (NQ_F)
The NQ_F is holding near breakout levels, just above heavy congestion as it was yesterday. Dips are likely to be bought as moving averages and formations as a group look bullish, but overhead resistance is holds strong. Support remains near 4641-4645, with a lower break into 4627, if sellers gain traction. Resistance levels are between 4662-4664. Breaches should retest before any real expansion holds.
Upside trades on Nasdaq futures – Favorable setups sit on the positive retest of 4662, or a positive retest of 4649.5 with positive momentum. I use the 30min to 1hr chart for the breach and retest mechanic. Watch for the lower high to develop near 4658, if sellers exercise more power intraday. Targets from 4649.5 are 4653.25, 4658.75, 4661.25, 4664, 4670, 4674.75, 4677.25, and 4681 if buyers continue the rally north. Price is likely to retreat to higher support at these breakout levels, so be careful.
Downside trades on Nasdaq futures – Favorable setups sit below the failed retest of 4647.5, or at the failed retest of 4662.5 with negative divergence. Watch those moving averages and trend lines when taking the shorts. Retracement into lower levels from 4662.5 gives us the targets 4660.25, 4658.5, 4653.75, 4650.25, 4645.5, 4642.5, 4637.75, 4632.75, 4628.5, 4624.75, 4621.25, 4618.75, 4615.75, 4614, 4611.25, 4606.75, 4598.75, 4592.5, and 4585.5 to 4580.75, if sellers resume control.
Crude Oil
Momentum is negative with new near term lows, as we move into an API report very likely to show a big build as producers continue to deliver product to the market. A big support area near 42.45 will be key to watch today. With buyers still trapped, and sellers moving into the space, we should see a failure of bounce action today. But we are quite near a bounce zone for oil prices.
Trading ranges on crude oil should hover between 42.05 and 44.36, with most trading signals suggesting that bounces will fail.
Upside trades for crude oil are quite countertrend here, but they can be staged on the positive retest of 42.65, or at a bounce off 42.05 with positive momentum. I often use the 30min to 1hr chart for the breach and retest mechanic. Targets from 42.05 are 42.26, 42.42, 42.64, 42.82, 42.97, 43.15, 43.37, 43.58, 43.83, 44.03, 44.22, 44.49, and perhaps, 44.71, if buyers really take control.
Downside trades for crude oil can be staged on the failed retest of 42.95, or at the failed retest of 42.4 with negative divergence. Targets from 42.95 are 42.7, 42.45, 42.27, 42.06, 41.94, 41.56, 41.13, and perhaps 40.74.
If you’re interested in the live trading room, it is now primarily stock market futures content, though we do track heavily traded stocks and their likely daily trajectories as well – we begin at 9am with a morning report and likely chart movements along with trade setups for the day.
As long as the trader keeps himself aware of support and resistance levels, risk can be very adequately managed to play in either direction as bottom picking remains a behavior pattern that is developing with value buyers and speculative traders.
Twitter: @AnneMarieTrades
The author trades stock market futures every day and may have a position in mentioned securities at the time of publication. Any opinions expressed herein are solely those of the author, and do not in any way represent the views or opinions of any other person or entity.


