Stock Market Outlook for October 20, 2016 –
There’s a strong potential for squeezing action intraday on the S&P 500 (INDEXSP:.INX). It appears that buyers are still holding the power, so I’ll be looking for tests of support to engage on the long side. We came into the S&P 500 futures target we have been watching all week and the behavior at this price resistance will be telling in the short-term. Price upport has shifted up to 2130.5. Market momentum continues to lift as charts rise into resistance.
See today’s economic calendar with a rundown of releases.
TODAY’S RANGE OF MOTION
S&P 500 Futures Trading Chart – October 20
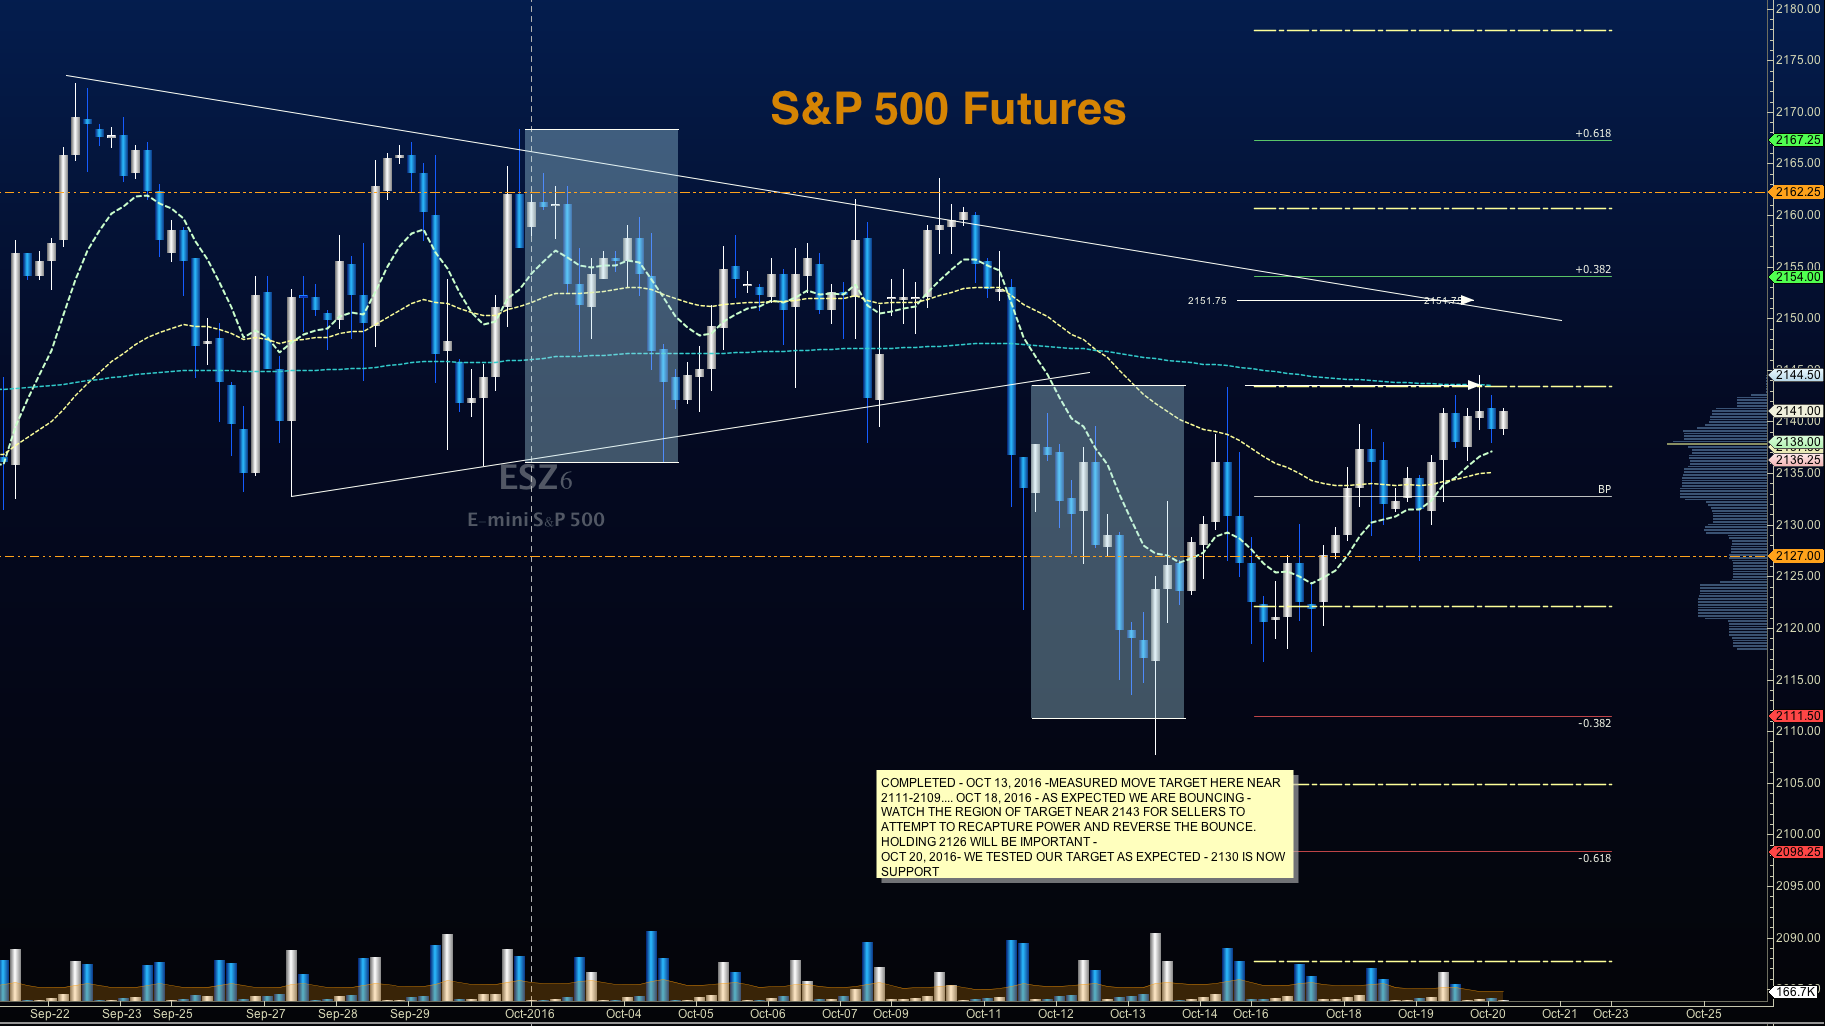
Upside trades on S&P 500 futures – Favorable setups sit on the positive retest of 2143.5, or a positive retest of the bounce off 2136.5 with upward momentum. I use the 30min to 1hr chart for the breach and retest mechanic. Targets from 2136.5 are 2139.5, 2141.50, 2144, 2147.25, 2150.5, and 2153.5.
Downside trades on S&P 500 futures – Favorable setups sit below the failed retest of 2136, or at the failed retest of 2151 (watch for the higher low if this is attempted) with negative divergence. Retracements into lower levels from 2151 give us the targets of 2147.75, 2144.5, 2141.5, 2138.5, 2136.5, 2134.25, 2130.75, 2126.5, and 2123.5 Additional targets will be in the Members only portion of the morning blog, and in the live trading room.
Nasdaq Futures
The NQ_F is holding positive levels of support overnight but the tight price action, as in the ES_F, is likely to frame an intraday trade outside these ranges. For the NQ_F, the range is approximately between 4822 (support) and 4844 (resistance). Congestion regions between 4828 and 4836 will make trading messy in these areas. Higher resistance sits near 4851 to 4854.
Upside trades on Nasdaq futures – Favorable setups sit on the positive retest of 4845.5, or a positive retest of 4825.5 with positive momentum. I use the 30min to 1hr chart for the breach and retest mechanic. Targets from 4825.5 are 4827.75, 4832.75, 4836.75, 4842.5, 4844, and 4848.5. Above there, and we could see 4851-4861.
Downside trades on Nasdaq futures – Favorable setups sit below the failed retest of 4823.75 (needs negative momentum here for continuation), or at the failed retest of 4851 with negative divergence. Retracements into lower levels from 4851 are 4845.5, 4841.5, 4837.5, 4835.25, 4833, 4829.75, 4825.75, and 4815.75 to 4811.5.
Crude Oil
After both the EIA and API reported draws, traders are taking profits this morning – a continuation of the selloff from the top. The levels between 50.7 and 50.6 will likely hold as support. Resistance levels remains 52.2, with 52.42 above. Price action holds a breakout formation, though it is jammed up against resistance levels.
Trading ranges for crude oil should still hold between 50.4 and 52.42 in the current pattern.
Upside trades on crude oil can be staged on the positive retest of 51.23, or at a positive retest off 51.02 with positive momentum. I often use the 30min to 1hr chart for the breach and retest mechanic. Targets from 51.02 are 51.14, 51.31, 51.45, 51.61, 51.76, 52.02, and 52.24 to 52.42.
Downside trades on crude oil can be staged on the failed retest of 51.53 (watch for higher lows with this test), or at the failed retest of 51.81 with negative divergence. Targets from 51.81 are 51.69, 51.59, 51.46, 51.32, 51.15, 50.92, 50.71, 50.62, 50.38, 50.24, 50.08, and 49.94.
Visit TheTradingBook.com for more insights & stock market futures analysis.
If you’re interested in the live trading room, it is now primarily stock market futures content, though we do track heavily traded stocks and their likely daily trajectories as well – we begin at 9am with a morning report and likely chart movements along with trade setups for the day.
As long as the trader keeps himself aware of support and resistance levels, risk can be very adequately managed to play in either direction as bottom picking remains a behavior pattern that is developing with value buyers and speculative traders.
Twitter: @AnneMarieTrades
The author trades stock market futures every day and may have a position in mentioned securities at the time of publication. Any opinions expressed herein are solely those of the author, and do not in any way represent the views or opinions of any other person or entity.
")


")

