Stock Market Outlook for October 14, 2016 – A bounce is in play, but 2141 -2144 stands in the way as key price resistance.
The completion of the measured move on S&P 500 futures (see chart below) clearly formed the order of the day. Overnight, we breached 2130, and now sit at crowded price resistance. The chart needs to recapture 2144 and hold; otherwise, sellers will still have the upper hand. Price resistance is lodged at 2141-2144, and support is well below at 2123-2126. SeeHave I mentioned we are range bound? Yes, about one hundred times.
See today’s economic calendar with a rundown of releases.
TODAY’S RANGE OF MOTION
S&P 500 Futures Trading Chart – October 14
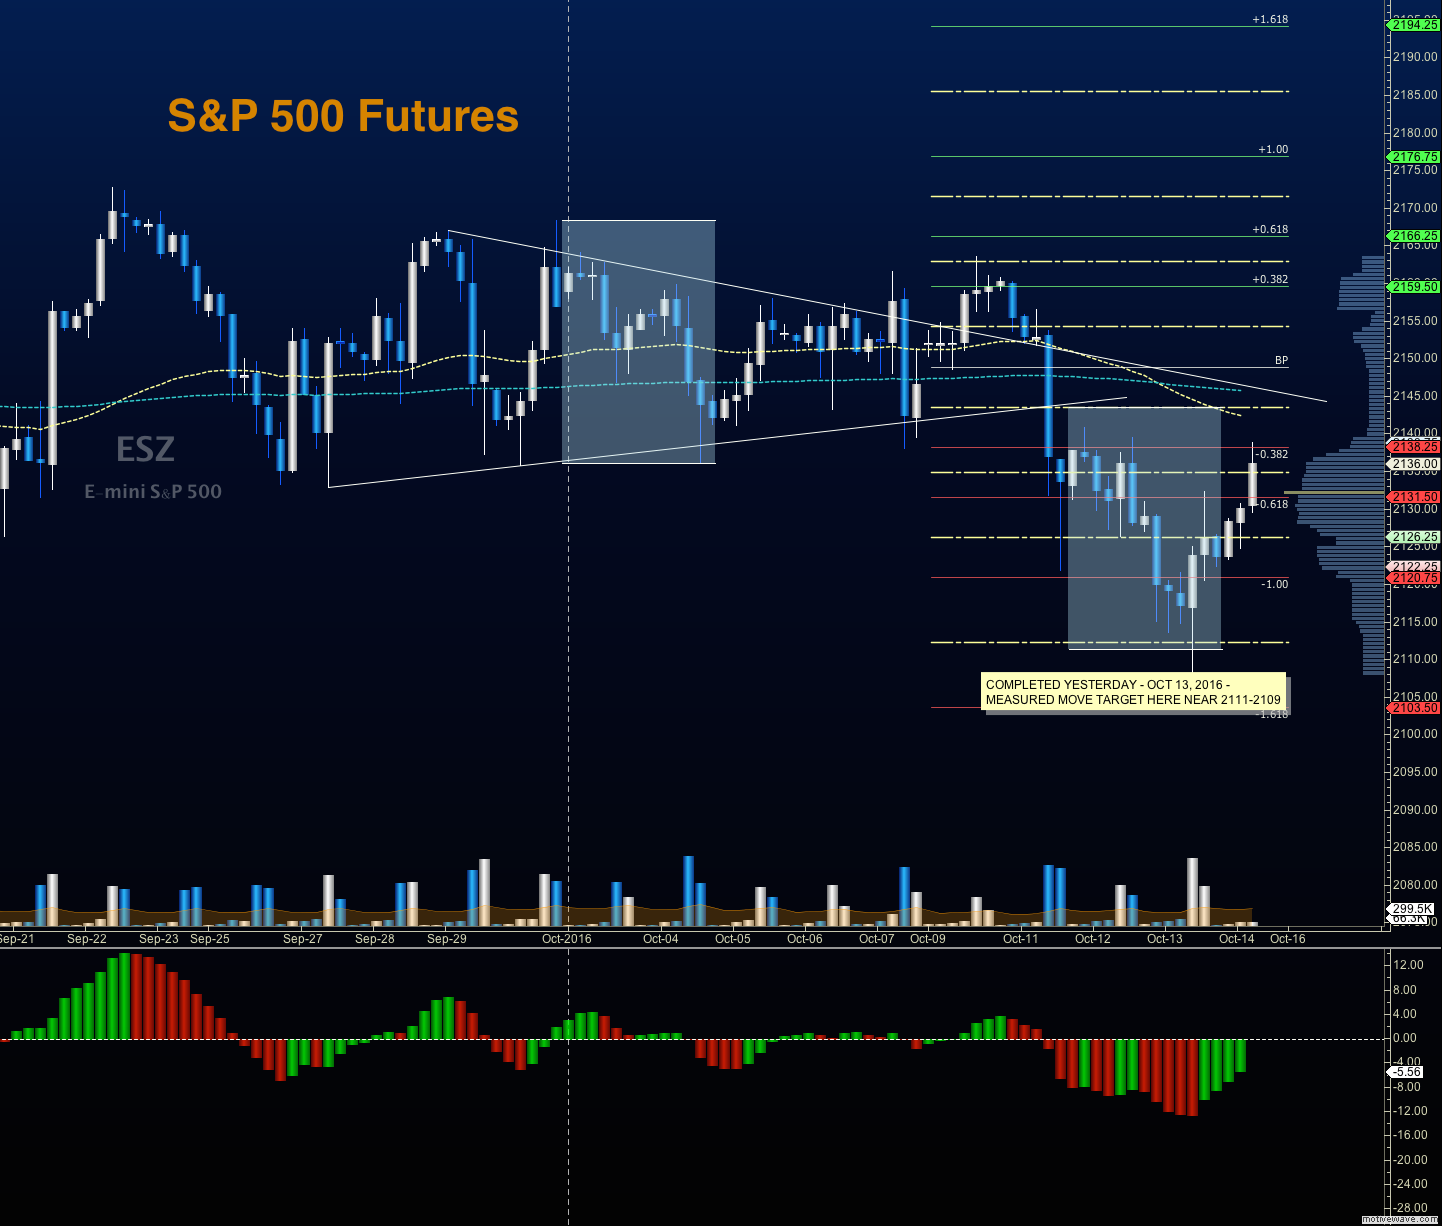
Upside trades on S&P 500 futures – Favorable setups sit on the positive retest of 2132, or a positive retest of the bounce off 2126 with upward momentum. I use the 30min to 1hr chart for the breach and retest mechanic. Targets from 2126 are 2129, 2132, 2136, 2138, 2140.50, 2144, and 2146.5. As always, additional targets will be in the Members only portion of the morning blog.
Downside trades on S&P 500 futures – Favorable setups sit below the failed retest of 2129, or at the failed retest of 2135 with negative divergence. A big bounce into 2151 could also bring sellers to the fore. Watch order flow there, as the trade could be against the wind. Retracements into lower levels from 2135 give us the targets 2132.5, 2129.75, 2124.75, 2121.75, 2115.5, 2111.25, and 2109.5.
Nasdaq Futures
The NQ_F plunged into deep support near 4854 yesterday, and began the current recovery shortly after. Congestion regions hold the chart range bound, between 4814 and 4822. Resistance sits above at 4832 – 4841. Momentum is bullish, forcing support into 4796-4802.
Upside trades on Nasdaq futures – Favorable setups sit on the positive retest of 4824.25, or a positive retest of 4803 with positive momentum. Bounces are likely to be into resistance for now. I use the 30min to 1hr chart for the breach and retest mechanic. Targets from 4803 are 4805.75, 4808.25, 4812.25, 4816.75, 4822, 4824, 4832, 4836.75, 4841.5, and 4846.
Downside trades on Nasdaq futures – Favorable setups sit below the failed retest of 4795 (needs negative momentum here for continuation), or at the failed retest of 4841.25 with negative divergence. Retracements into lower levels from 4841.25 are 4837.25, 4832.75, 4825.25, 4817.75, 4813.25, 4810.25, 4803.5, 4800.75, 4797.75, 4795.5, and 4790.5. See the blog for additional targets.
Crude Oil
Resistance was overcome after a battle at 50.63 for almost six hours. The second group of sellers sit near the 51.17 space I mentioned yesterday. The EIA reported a build, driving price into deep value areas; since then, the buyers have had a slow even march upward. Price action here is orderly – as if the traders are comfortable moving in and out of positions through the range. Sellers now sit near 51.3. Support is higher today, near 50.6 to 50.36.
Trading ranges for crude oil should hold between 49.84 and 51.49 in the current pattern.
Upside trades on crude oil futures can be staged on the positive retest of 50.64, or at a positive retest off 50.22 with positive momentum. I often use the 30min to 1hr chart for the breach and retest mechanic. Targets from 50.33 are 50.35, 50.63, 50.85, 51.02, 51.16, 51.36, and 51.49.
Downside trades on crude oil futures can be staged on the failed retest of 50.59, or at the failed retest of 51.29 with negative divergence. If the price tests above 51.35 in the current space we are likely to breach into higher highs, so use caution shorting at the top. Targets from 51.29 are 51.15, 50.94, 50.71, 50.62, 50.38, 50.24, 50.08, 49.84, 49.68, and 49.57.
If you’re interested in watching these trades go live, join us in the live trading room from 9am to 11:30am each trading day.
Visit TheTradingBook.com for more information.
If you’re interested in the live trading room, it is now primarily stock market futures content, though we do track heavily traded stocks and their likely daily trajectories as well – we begin at 9am with a morning report and likely chart movements along with trade setups for the day.
As long as the trader keeps himself aware of support and resistance levels, risk can be very adequately managed to play in either direction as bottom picking remains a behavior pattern that is developing with value buyers and speculative traders.
Twitter: @AnneMarieTrades
The author trades stock market futures every day and may have a position in mentioned securities at the time of publication. Any opinions expressed herein are solely those of the author, and do not in any way represent the views or opinions of any other person or entity.

 Rolling Over At Key Fibonacci Level?")


