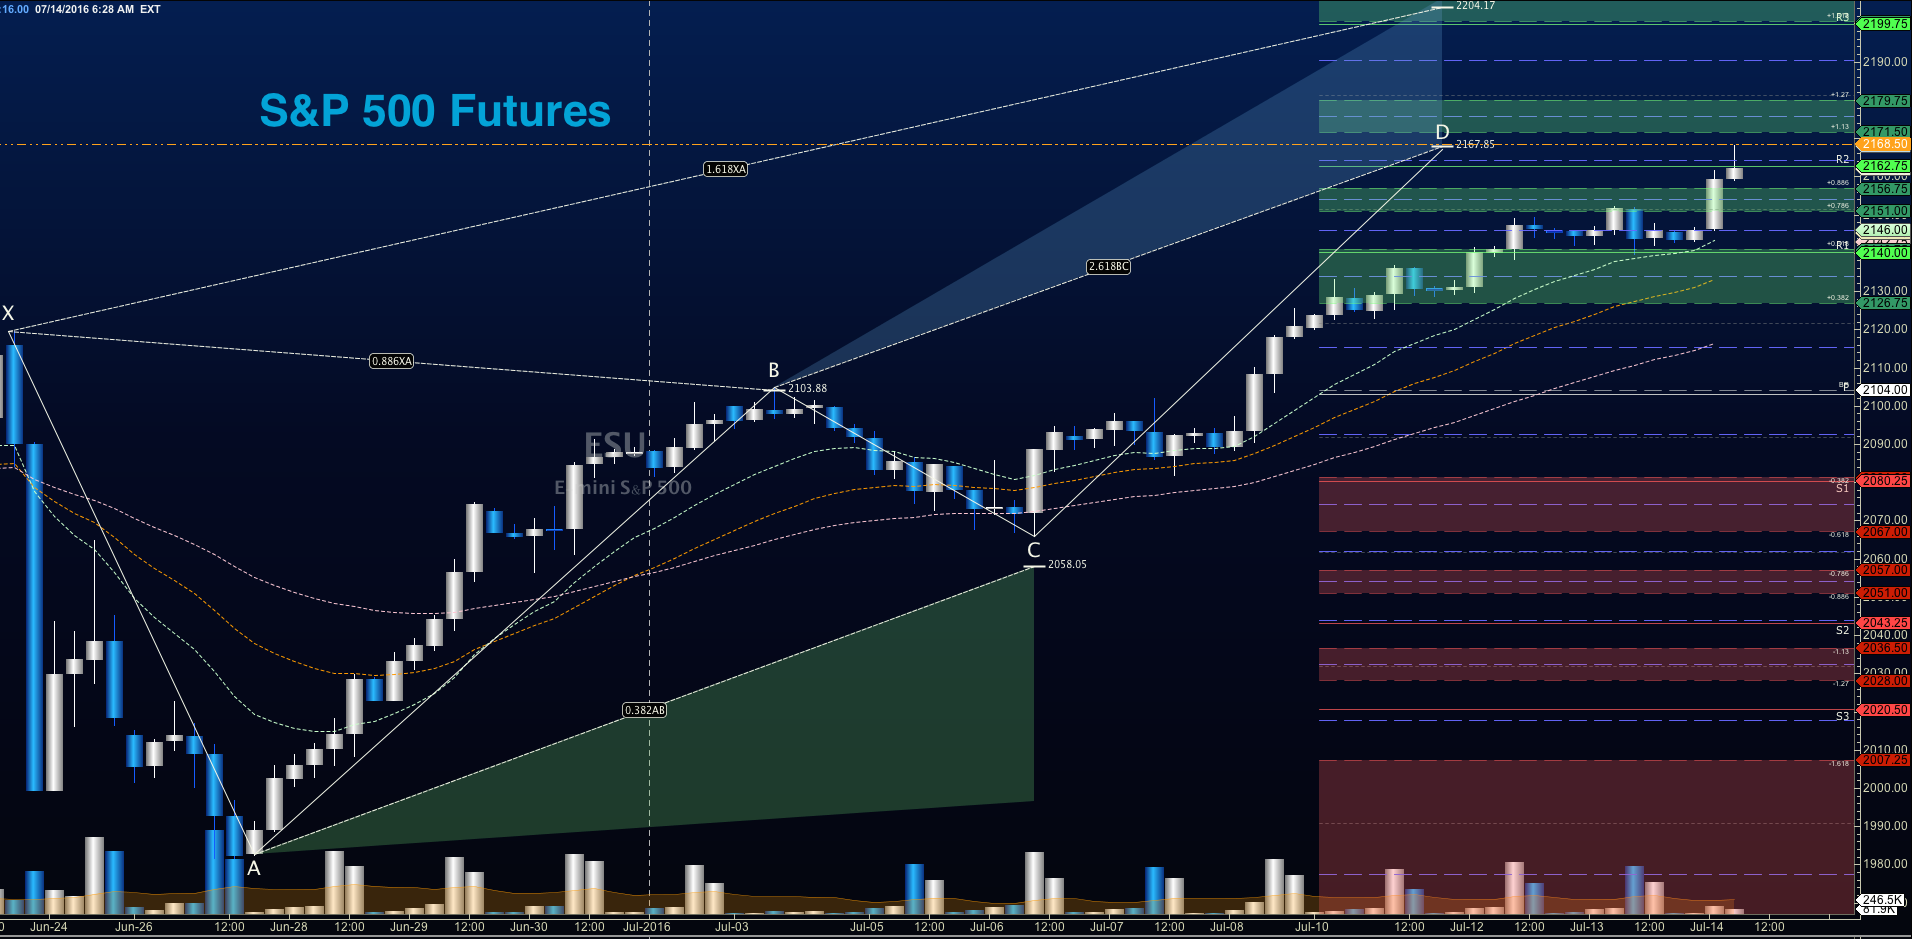
S&P 500 Futures Trading Outlook for July 14, 2016 – The strong bullish trend across stock market futures remains in place. This is evidenced by a hold of support yesterday and a breakout to higher levels this morning. The rally has brought S&P 500 futures directly into the crab pattern target zone (see below). You can also see this on the S&P 500 Index (INDEXSP:.INX) and SPDR S&P 500 ETF (NYSEARCA:SPY).
There is a bigger expansion for S&P 500 futures into 2179.75, 2190, and 2204.25, but moving there all at once would be quite a feat. A technical divergence continues beneath the price action, so I remain cautiously long on pullbacks. The moving averages across the board still show trending formations, so betting against buyers is risky business at this time. Key price support between 2139 and 2141 held, and that was certainly important for traders. Now the level to hold will be near 2159. Failure there would allow for a drift to the 2151 region and below. Resistance is near 2167.75, but range expansion could take that to 2179.5, if buyers keep the press going after a test of support.
See today’s economic calendar with a rundown of releases.
RANGE OF TODAY’S MOTION
E-mini S&P Futures
Upside trades on S&P 500 futures – Favorable setups sit on the positive retest of 2162.5, or a positive retest of the bounce off 2151.5 with positive momentum. Keep an eye out for lower highs to set in, as this could signal that sellers are collecting strength. I use the 30min to 1hr chart for the breach and retest mechanic. Targets from 2151.5 are 2153.5, 2157.5, 2162, 2167.5, 2171.5, 2175.75, and if we expand, we are likely to stretch above into 2179.75.
Downside trades on S&P 500 futures – Favorable setups sit below the failed retest of 2151 or at the first failed retest of 2162.5 with negative divergence. As this is a countertrend trade, make sure that you keep your eyes on the lookout for higher lows developing intraday. Retracement into lower levels from 2162.5 gives us the targets 2157.75, 2154.25, 2151.25, 2147.75, 2145.75, 2143, 2141.75, 2138.75, 2136.5, 2134.5, 2128.25, 2124.5, 2122.75, and 2120.75 to 2118.5, if sellers take over.
Have a look at the Fibonacci levels marked in the blog for more targets.
Nasdaq Futures
Nasdaq futures, though slightly underperforming the S&P 500 futures, crested higher into resistance levels between 4606.75. But it also has the same negative divergence, suggesting a drift into support near 4584.5. Additional price support levels to watch are now 4574.5-4571.5 , and a lower test near 4561. Yesterday’s post allowed us to see the bottom support hold nicely near 4553 in after hours trading. We’ll watch to see if the new support proposed holds. If not, we’ll head back to yesterday’s support levels near 4561.75. Resistance sits in a space between 4606.75 and 4617.25.
Upside trades on Nasdaq futures – Favorable setups sit on the positive retest of 4596.75, or a positive retest of 4584.5 with positive momentum. I use the 30min to 1hr chart for the breach and retest mechanic. Watch for the lower high to develop near 4596, if sellers exercise more power intraday. Targets from 4584.5 are 4587, 4590.5, 4592.25, 4596.75, 4602.5, 4606.75, 4608.5, and 4611.75 to 4617.25, if buyers overpower sellers sitting near 4606.
Downside trades on Nasdaq futures – (Still very countertrend) -Favorable setups sit below the failed retest of 4582.5, or at the failed retest of 4594 with negative divergence. Watch those moving averages and trend lines when taking the shorts. Retracement into lower levels from 4594 gives us the targets 4591.25, 4587.75, 4584.4, 4582.25, 4579.75, 4574.5, 4571.5, 4568.25, 4566.5, 4563.75, 4561.5, 4557, 4552.5, 4546.5, 4542.75, 4540, 4538.25, and 4532 to 4528.75, if sellers resume control.
Crude Oil
The EIA reported a larger build, and as suspected, this brought the chart downward. Crude Oil prices bounced off a double bottom on the four hour chart near 44.5, and though some positive divergence exists, I surmise that this bounce ends in failure near 45.74. Momentum and trend are both mixed; that usually lends itself to jagged price action.
The trading range on crude oil today appear to be 44.15 to 46.6 – volatility continues to reign- meaning, we could see stretches outside these regions easily. Price action is likely to collapse back into the range, if it expands.
Upside trades on crude oil can be staged on the positive retest of 45.74, or at a bounce off 44.94 with positive momentum. I often use the 30min to 1hr chart for the breach and retest mechanic. Targets from 44.94 are 45.12, 45.49, 45.63, 45.74, 45.98, 46.16, 46.34, 46.48, 46.6, 46.9, 47.04, 47.32, 47.56, 47.74, and 48.14; if traders try once again to recapture 48.
Downside trades on crude oil can be staged on the failed retest of 44.93, or at the failed retest of 45.7 with negative divergence. Targets from 45.7 are 45.58, 45.32, 45.11, 44.89, 44.67, 44.48, 44.29, 44.16, 44.02, 43.84, and 43.65, if selling really takes hold.
If you’re interested in the live trading room, it is now primarily stock market futures content, though we do track heavily traded stocks and their likely daily trajectories as well – we begin at 9am with a morning report and likely chart movements along with trade setups for the day.
As long as the trader keeps himself aware of support and resistance levels, risk can be very adequately managed to play in either direction as bottom picking remains a behavior pattern that is developing with value buyers and speculative traders.
Twitter: @AnneMarieTrades
The author trades stock market futures every day and may have a position in mentioned securities at the time of publication. Any opinions expressed herein are solely those of the author, and do not in any way represent the views or opinions of any other person or entity.
 Rolling Over At Key Fibonacci Level?")


 Rolling Over At Key Fibonacci Level?")