Before we get into the details of today’s trading action and the S&P 500 futures trading outlook, let’s start with a broad stock market overview.
The S&P 500 Index (INDEXSP:.INX) steady drift down into the bottom of the market’s broad range saw several failed bounces. Some say this is just the stock market trading ahead of the Yellen speech, however I am uncertain of causal attributes here. Simply saying, “Hey, we’re at the top of the range. Time to trade it to the bottom,” isn’t good enough. This is just as valid a ‘reason’ as any other in range bound price action and formations. If it does have to do with Yellen, trading in S&P 500 futures will be range bound again today on the lower edges, with a low volume region near 2170 acting like a magnet until it fills in. Primary price support holds at 2169 intraday, with 2166.5, 2163.25, and 2159.25 below that. Price resistance sits near 2179, but could stretch into 2185.5 and 2190.50.
See today’s economic calendar with a rundown of releases.
RANGE OF TODAY’S MOTION
S&P 500 Futures Trading Outlook For August 25 – ES_F Trading Chart
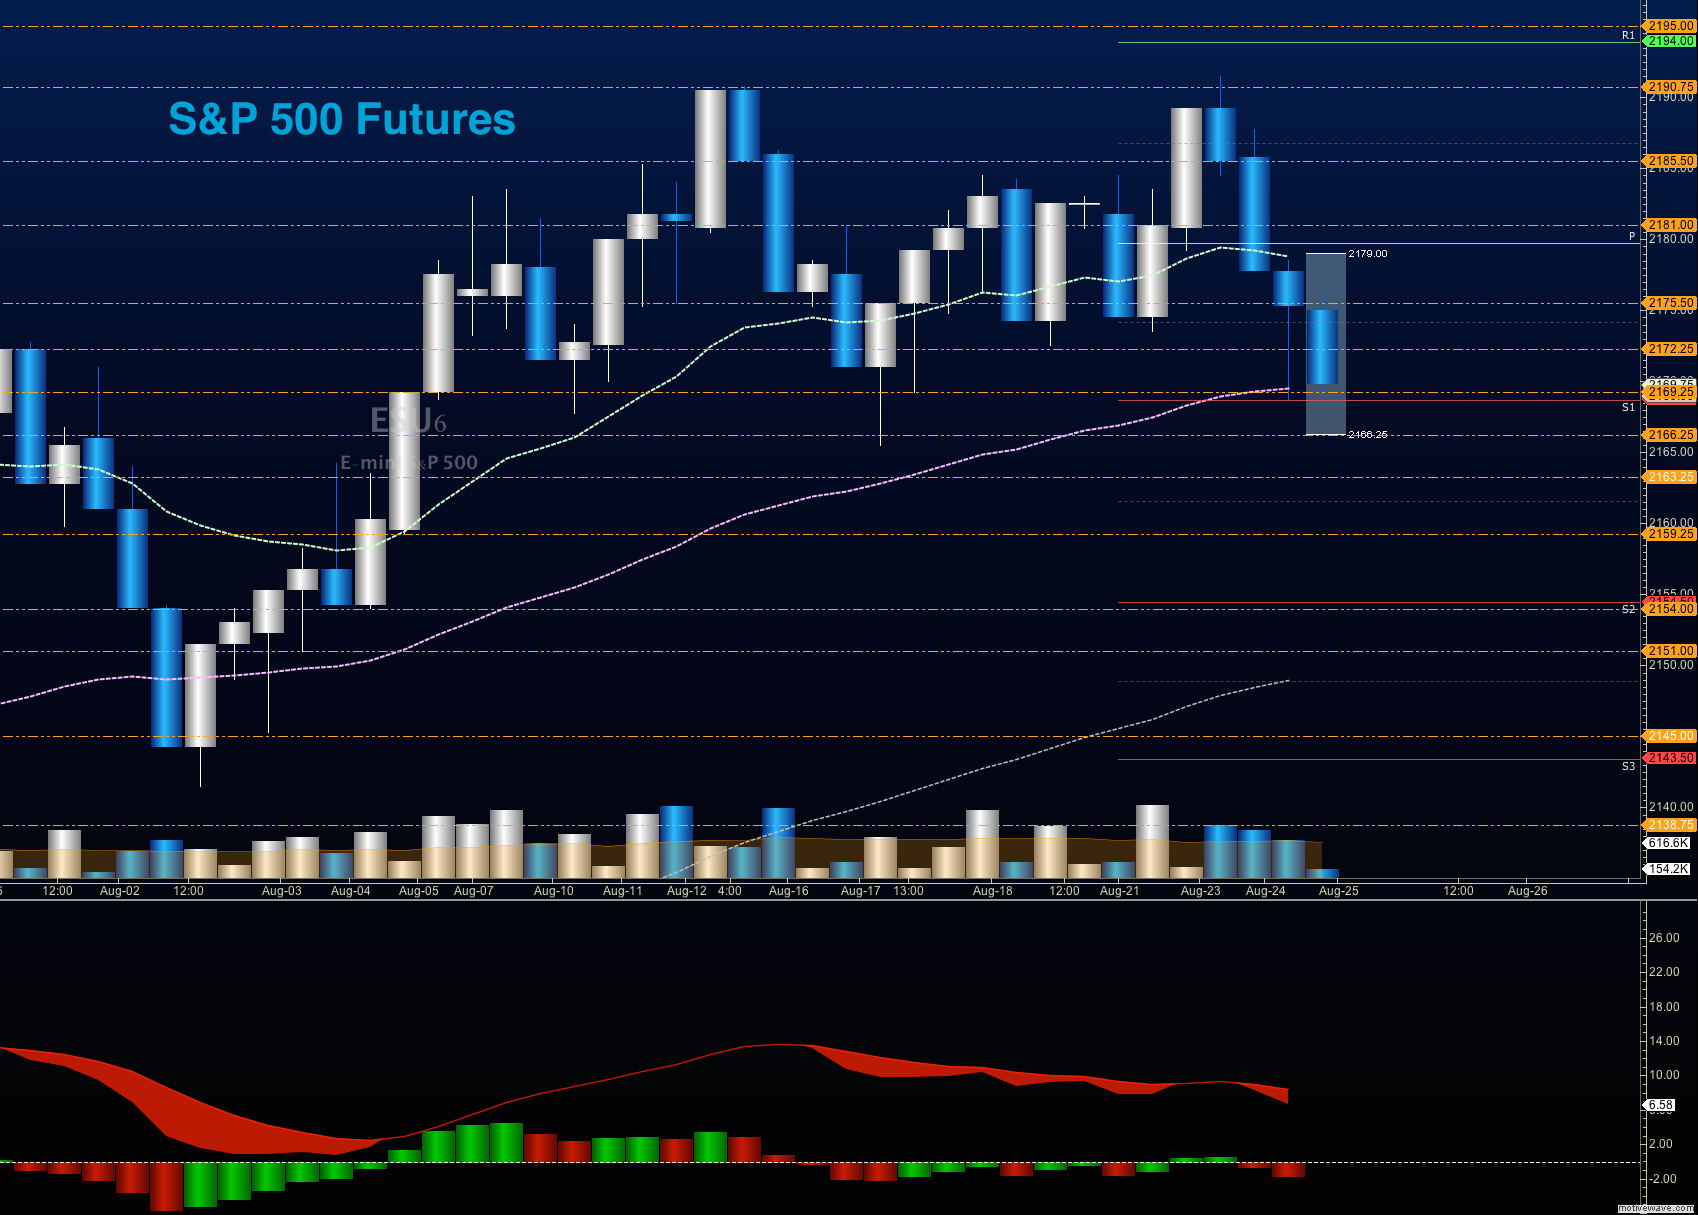
Upside trades in S&P 500 futures trading – Favorable setups sit on the positive retest of 2177.25, or a positive retest of the bounce off 2169.5 with upward momentum. If we spike downward into 2174.5, it should prove out as a bounce zone, as well. I use the 30min to 1hr chart for the breach and retest mechanic. Targets from 2169.5 are 2172.25, 2176.25, 2179, 2181.75, 2184.5, 2187.5, 2189.25, if we expand, we may stretch above into 2191.75 and 2194.75.
Downside trades in S&P 500 futures trading – Favorable setups sit below the failed retest of 2168.5, or at the failed retest of 2179.5 with negative divergence. Retracement into lower levels from 2179.5 gives us the targets 2177.5, 2174.5, 2172.5, 2168.5, 2165.25, 2162, 2158.5, and 2154.75, if sellers take over.
If you’re interested in watching these trades go live, join us in the live trading room from 9am to 11:30am each trading day.
Nasdaq Futures
The NQ_F faded with the rest of the broad indices yesterday, and now sits near 4772.5, just above the base of support between 4766 and 4767. Support was swiftly broken yesterday so a retrace over the coming days seems likely. Resistance sits between 4796.5-4806.75.
Upside trades in Nasdaq futures trading – Favorable setups sit on the positive retest of 4789.5, or a positive retest of 4770.5 with positive momentum. I use the 30min to 1hr chart for the breach and retest mechanic. Targets from 4770.5 are 47845, 4789.5, 4792.25, 4796.5, 4806.25, 4815.5, 4821.5, 4824.25, and 4829, if buyers continue the rally north.
Downside trades in Nasdaq futures trading – Favorable setups sit below the failed retest of 4772, or at the failed retest of 4784.5 with negative divergence (particularly important here). Retracement into lower levels from 4784.5 gives us the targets 4781, 4775.5, 4770.5, 4767.25, 4766, 4764, and 4760.5 to 4753.5, if sellers resume control.
Crude Oil
Oil continues its downward slide from yesterday, coming back to retest the level near 46.4. We certainly could track lower here into 45.57, but lots of energy is being exerted into the formation at the 46.45 region. Currently support holds at 46.24, and below there, 45.98. Resistance sits near 47.32, with 47.58 above that.
Trading ranges in crude oil should hold between 45.5 and 47.58 today.
Upside trades on crude oil futures can be staged on the positive retest of 46.84, or at a positive retest off 46.44 with positive momentum. I often use the 30min to 1hr chart for the breach and retest mechanic. Targets from 46.44 are 46.65, 46.78, 46.92, 47.06, 47.21, 47.33, 47.56, 47.76, 47.9, and the outside chance that we see 48.05, if buyers power forward.
Downside trades on crude oil futures can be staged on the failed retest of 46.4, or at the failed retest of 47.06 with negative divergence. Targets from 47.06 are 46.96, 46.74, 46.49, 46.26, 46.06, 45.98, and 45.81 to 45.57, if sellers continue control.
If you’re interested in the live trading room, it is now primarily stock market futures content, though we do track heavily traded stocks and their likely daily trajectories as well – we begin at 9am with a morning report and likely chart movements along with trade setups for the day.
As long as the trader keeps himself aware of support and resistance levels, risk can be very adequately managed to play in either direction as bottom picking remains a behavior pattern that is developing with value buyers and speculative traders.
Twitter: @AnneMarieTrades
The author trades stock market futures every day and may have a position in mentioned securities at the time of publication. Any opinions expressed herein are solely those of the author, and do not in any way represent the views or opinions of any other person or entity.
 Rolling Over At Key Fibonacci Level?")


