S&P 500 futures macro outlook for July 1, 2016 – We certainly ended the month with a bang. We have seen a monster move into resistance and a three-day weekend. Conventional thought says that after such a volatile week that traders might not go into the weekend levered extensively on the long side in the stock market. However, in flows can clearly be observed here.
S&P 500 futures (ES_F) has been ruled by the buyers and is holding well above initial targets for the week set at 2067.75. A new band of congestion sits near 2085.5 to 2094.5, and beyond that, we see 2097. New support on S&P 500 futures sits at 2062.25-2066. Momentum today suggests that we find buyers on pullbacks into support, once again. The bullish undercurrent for stocks is very strong, but holding steady. Charts continue to trend, but neutral zone momentum could give us lots of tall wicks.
See today’s economic calendar with a rundown of releases.
RANGE OF TODAY’S MOTION
E-mini S&P Futures
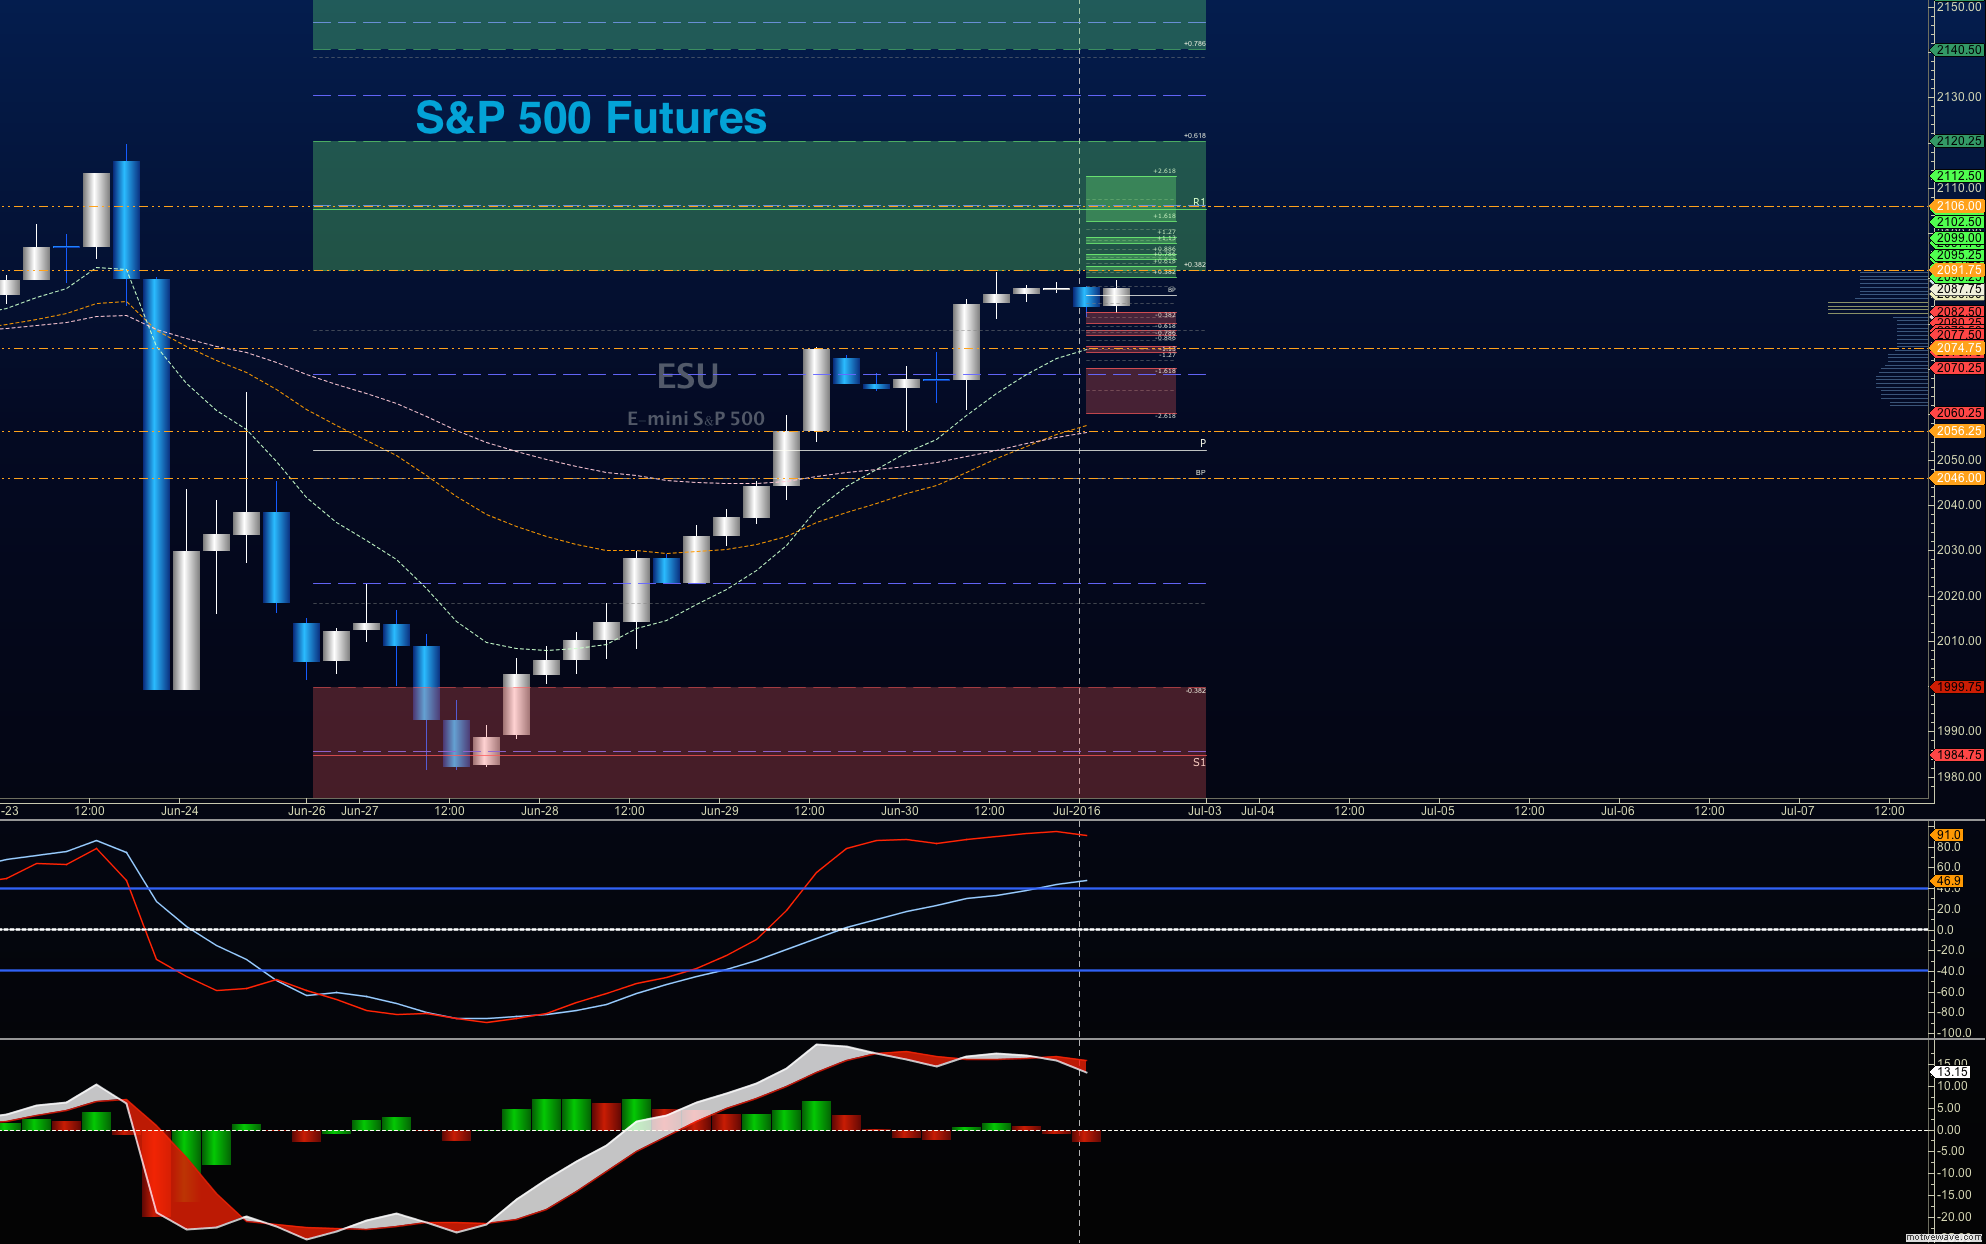
S&P 500 Futures Trading Outlook for July 1, 2016 –
Upside trades in S&P 500 futures trading – Favorable setups sit on the positive retest of 2082.5, or a positive retest of the bounce off 2075.5 with positive momentum. Be very careful watching for sellers showing up near 2086.5, with the entry near 2075.5, as failure there could signal that sellers might try to resume power. Buying power remains strong. I use the 30min to 1hr chart for the breach and retest mechanic. Targets from 2075.5 are 2077.5, 2078.75, 2082.5, 2086, 2089.5, 2091.25, 2093.5, and 2097.25.
Downside trades in S&P 500 futures trading – Favorable setups sit below the failed retest of 2072.25 or at the failed retest of 2097.5 with negative divergence. It is important to watch for higher lows to develop with the 2097.5 entry, as the chart may be attempting a retest of the recent high under the current bullish environment. Retracement into lower levels from 2097.5 gives us the targets 2094.4, 2091.25, 2089.5, 2086.25, 2082.5, 2078.75, 2075.25, 2071.75, 2068.75, and 2064.25 to 2061.5.
Have a look at the Fibonacci levels marked in the blog for more targets.
Nasdaq Futures
Trading outlook for Nasdaq futures for July 1, 2016 (NQ_F) – Nasdaq futures sit just beneath the 12 monthly simple moving average, after breaching the weekly 1osma on the composite chart. A band of congestion holds near at 4421 through 4432. As long as we observe candlesticks giving us higher lows on hourly frames, we can see the likelihood of a continued press forward. Support is near 4378.5, and if sellers press further, deeper support lies near 4356.
Upside trades on Nasdaq futures – Favorable setups sit on the positive retest of 4401.5, or a positive retest of 4394.5 with positive momentum. I use the 30min to 1hr chart for the breach and retest mechanic. Watch for the lower high to develop in the long opening at 4401.5, if sellers try to take over intraday. Targets from 4394.5 are 4397.5, 4401.25, 4405, 4408.75, 4410.75, 4412.25, 4415, 4420.5, and 4424.25 .
Downside trades on Nasdaq futures – Favorable setups sit below the failed retest of 4396 or at the failed retest of 4410 with negative divergence. Retracement into lower levels from 4410 gives us the targets 4405.75, 4401.5, 4399, 4395.5, 4391.5, 4389.5, 4386.25, 4384, 4378.25, and 4370.75 to 4364.75.
Crude Oil
Trading Outlook for Crude Oil futures for July 1, 2016 (CL_F)
The trading range on crude oil suggests support action near 47.32, and resistance behavior near 49.34.
Upside trades on crude oil futures can be staged on the positive retest of 48.86, or at a bounce off 47.74 with positive momentum. I often use the 30min to 1hr chart for the breach and retest mechanic. Targets from 47.74 are 48.12, 48.47, 48.64, 48.84, 49.04, 49.28, 49.54, 49.9, 50.14, 50.32, and 50.54.
Downside trades on crude oil futures can be staged on the failed retest of 47.82, or at the failed retest of 49.12 with negative divergence. Targets from 49.12 are 48.84, 48.57, 48.34, 48.16, 47.98, 47.74, 47.48, 47.13, 46.89, 46.7, 46.44, and perhaps 46.27 to 45.87, though that seems extremely unlikely at this writing.
Have a look at the Fibonacci levels marked in the blog for more targets.
Visit TheTradingBook.com for more information.
If you’re interested in the live trading room, it is now primarily stock market futures content, though we do track heavily traded stocks and their likely daily trajectories as well – we begin at 9am with a morning report and likely chart movements along with trade setups for the day.
As long as the trader keeps himself aware of support and resistance levels, risk can be very adequately managed to play in either direction as bottom picking remains a behavior pattern that is developing with value buyers and speculative traders.
Twitter: @AnneMarieTrades
The author trades stock market futures every day and may have a position in mentioned securities at the time of publication. Any opinions expressed herein are solely those of the author, and do not in any way represent the views or opinions of any other person or entity.


")

 Ready To Break Out?")

")