S&P 500 futures outlook for May 3, 2016 – Another bounce has failed with downside motion so our eyes now turn to support around 2052, then a bigger level at 2046.
At the time of this writing, S&P 500 futures are holding near 2060, but under negative momentum. The next lower support on is 2052.75, 2050.5 and back to revisit Friday’s 2046.5 area.
If buyers completely step out of the way, we’ll have that move into 2042 to 2031. That would be quite bearish. The chart will continue to be vulnerable to sell-off as long as we stay below 2078.25.
Momentum on the four hour chart is negative, but flattening -suggesting that bounces will be still be sold. I’m looking at the 2068.5 retest to complete the current bounce action, as it seems we are in some kind of squeeze. Reversals are likely to be staged near this area, else we’ll see 2076.5, and 2078.25. Price action building near 2060 may give buyers the chance to plant a foothold that will force price action to the north again, but so far traders are having trouble doing this.
See today’s economic calendar with a rundown of releases.
THE RANGE OF TUESDAY’S MOTION
Crude Oil Futures (CL_F)
Outlook for Crude oil futures – The API Report comes out after the close. Crude oil continues to fade off the recent rise into major congestion seen on monthly charts. This significant overhead supply exerted pressure and allowed sellers to move the charts south. Support tests seem quite likely at first 44.11, and 43.37, if the sellers hold the line.
Upside motion on crude oil futures is countertrending currently (4hr chart). The best setup is on the positive retest of 45.49, or a bounce off 44.15 with positive momentum. I often use the 30min to 1hr chart for the breach and retest mechanic. Targets from 44.15 are 44.45, 44.68, 44.92, 45.14, 45.42, 45.72, 46.05, and if we can catch a bid there, we could expand into 46.53 to 46.94.
Downside motion on crude oil futures is trending into support levels below and opens below the failed retest of 44.42 or at the failed retest of 45.4 with negative divergence. Retracement into lower levels from 45.4 gives us the targets 45.14, 44.92, 44.53, 44.32, 44.11, 43.94, and perhaps 43.78 to 43.68, and 43.38.
E-mini S&P 500 Futures (ES_F)
Below is a S&P 500 futures chart with price support and resistance trading levels for today. Click to enlarge.
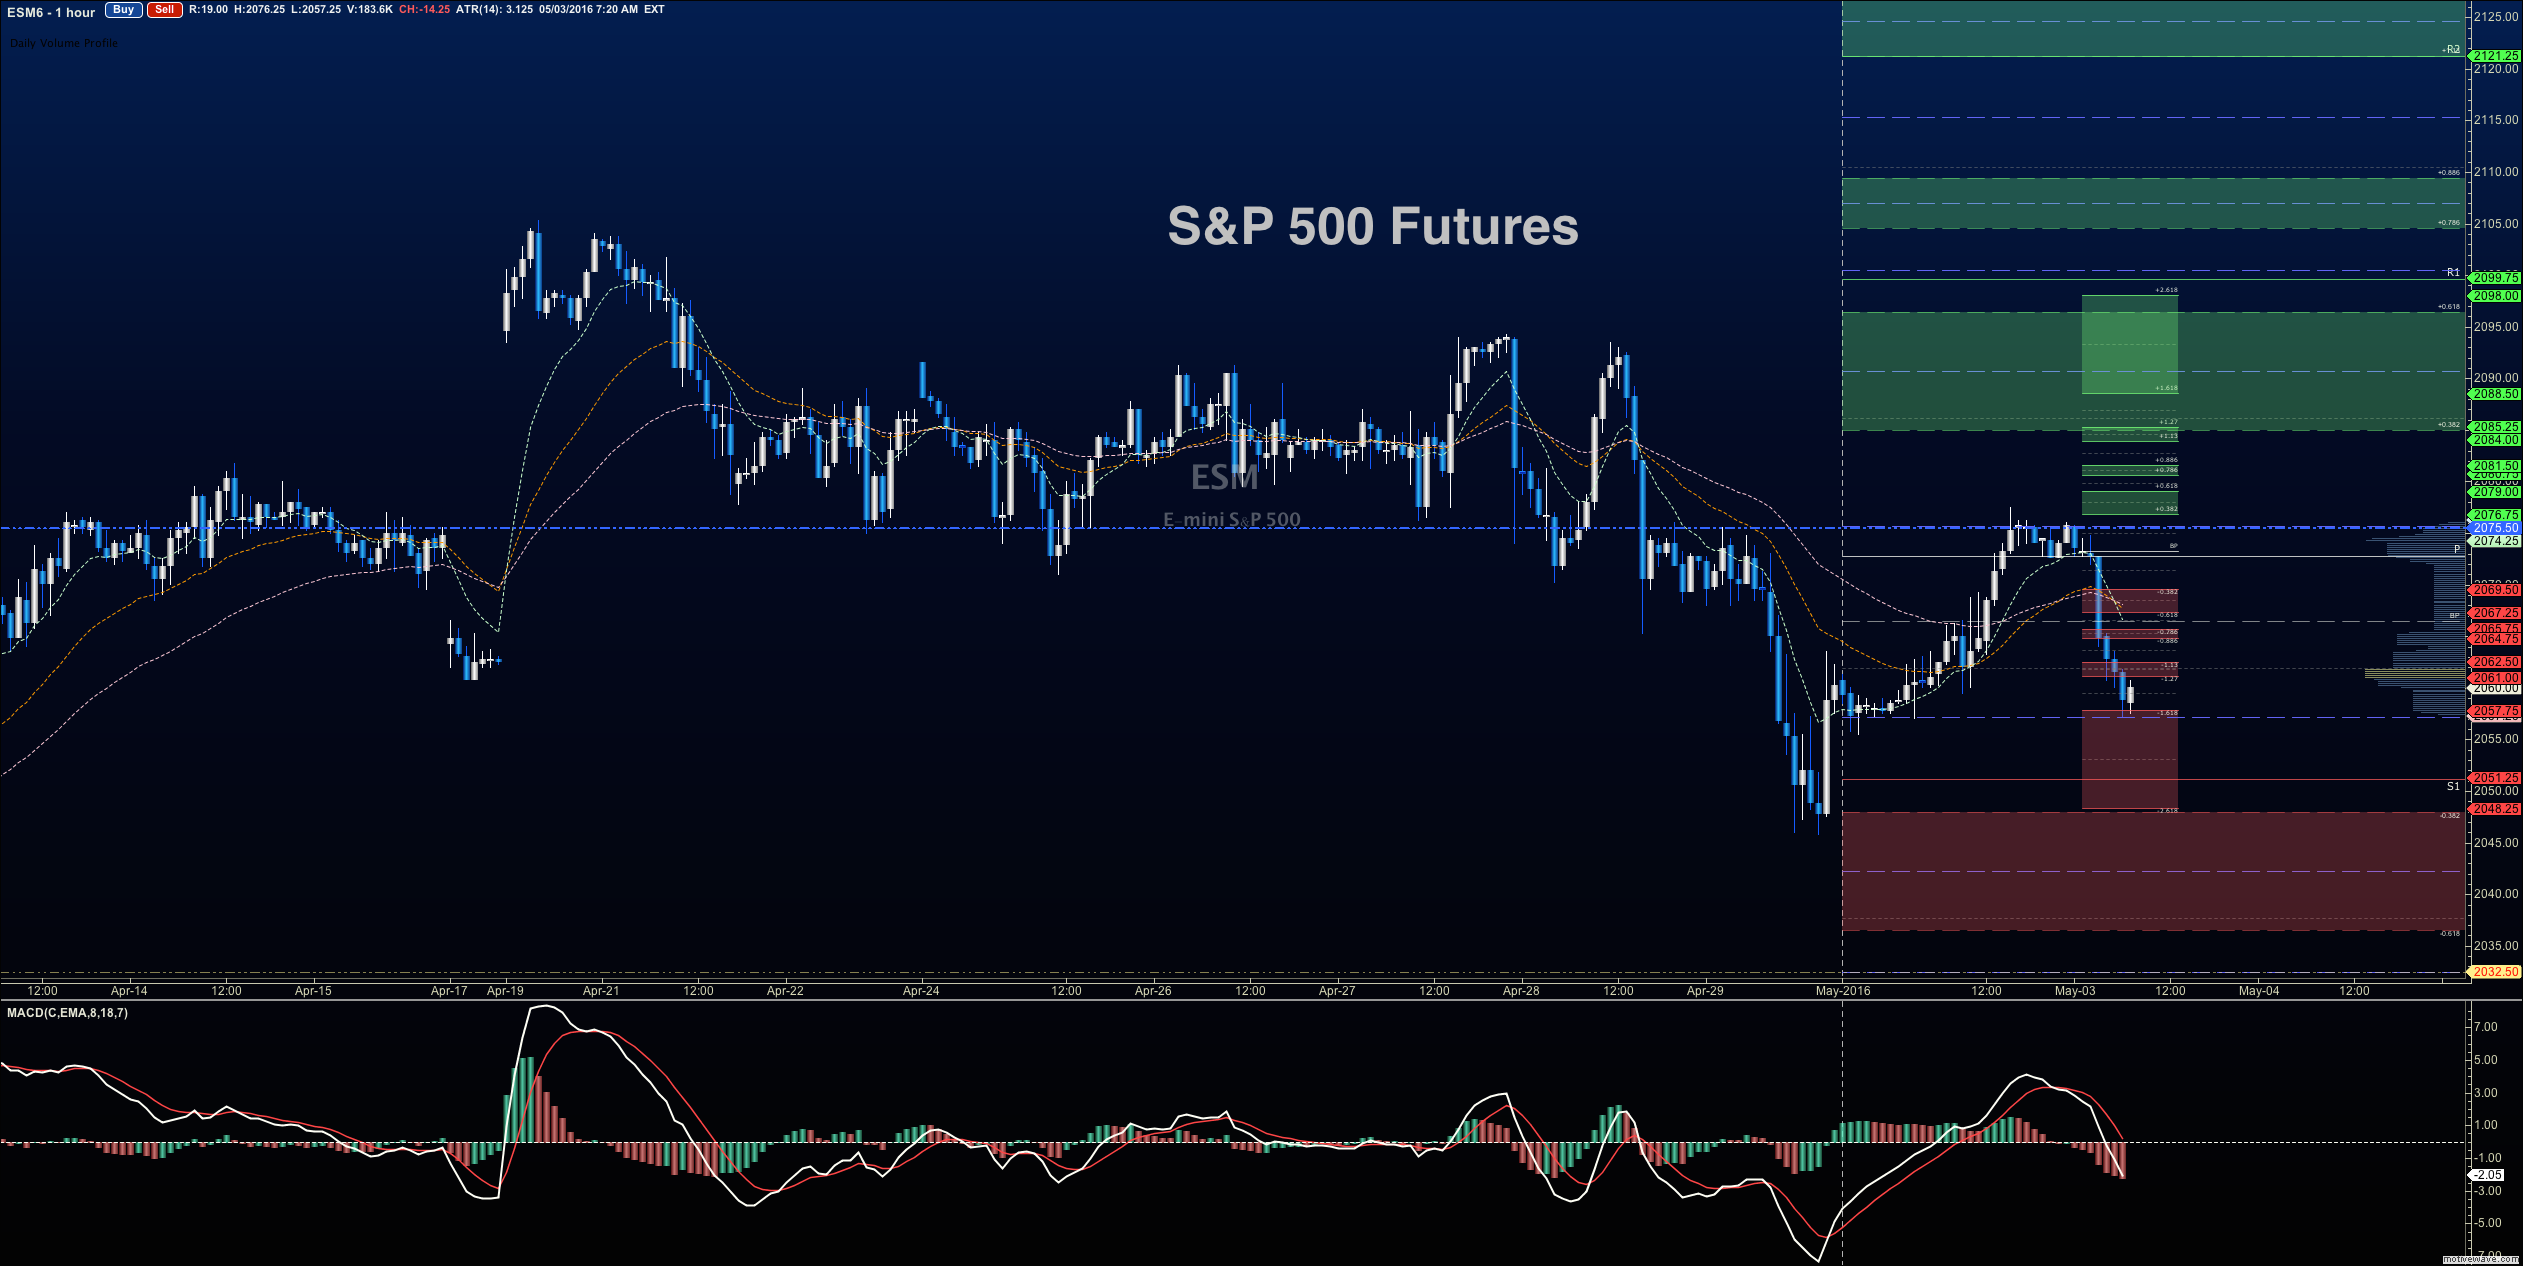
S&P 500 futures outlook for May 3, 2016 – Neutral to negative momentum with negative trend took the lead yesterday after the bounce completed into the close. The S&P 500 futures (ES_F) immediately began to give back gains, and now are testing key support.
Upside motion is countertrend at the moment with the 4hour time frame in mind, but has the best setup on the positive retest of 2057, or a bounce off 2051.75 with positive momentum – keep your eyes on 2057.25 with this 2051.75 entry. I use the 30min to 1hr chart for the breach and retest mechanic. Targets from 2051.75 are 2054.5, 2057, 2061.25, 2063.5, 2067.5, 2071.5, and if we can catch a bid there, we could expand into 2074.5, 2077.75, and 2082.75. Long action on S&P 500 futures is still trending over the bigger picture for now, but momentum continues to slow, and pullbacks seem quite frequent at resistance zones.
Downside motion opens below the failed retest of 2063.25 or at the failed retest of 2068 with negative divergence. There may be a very nice short waiting at the top of the current congested range, as there was yesterday, but watch for higher lows forming to let you know that buyers are advancing their agenda. Retracement into lower levels from 2063.25 gives us the targets 2060.25, 2057.75, 2054.5, 2051.5, 2048.75, 2046.5, and perhaps 2042.25 to 2037.75.
If you’re interested in the live trading room, it is now primarily stock market futures content, though we do track heavily traded stocks and their likely daily trajectories as well – we begin at 9am with a morning report and likely chart movements along with trade setups for the day.
As long as the trader keeps himself aware of support and resistance levels, risk can be very adequately managed to play in either direction as bottom picking remains a behavior pattern that is developing with value buyers and speculative traders.
Twitter: @AnneMarieTrades
The author trades stock market futures every day and may have a position in mentioned securities at the time of publication. Any opinions expressed herein are solely those of the author, and do not in any way represent the views or opinions of any other person or entity.
")


