S&P 500 futures outlook for May 31, 2016 – After a spike up into 2103.75 Sunday night, S&P 500 futures have struggled. In early trading, futures have failed to breach the level of breakout that exists above 2105.5.
That said, buy signals are firing off everywhere, and individual charts continue to strengthen within the SPX. But the retest of these breakout levels will remain the critical event that triggers a firm buy signal up here. 2088 looks like today’s support level to hold, and a breakout above 2105 leads to 2109.5 and 2112.25 as likely tests ahead. But that price area looks like firm resistance.
Momentum on the four-hour chart remains bullish: flattening somewhat and losing a little strength for now. Buyers are set to defend the support regions near 2087.5 -2094, and resistance looms above at 2103-2105.5.
See today’s economic calendar with a rundown of releases.
THE RANGE OF TUESDAY’S MOTION
E-mini S&P 500 Futures (ES_F)
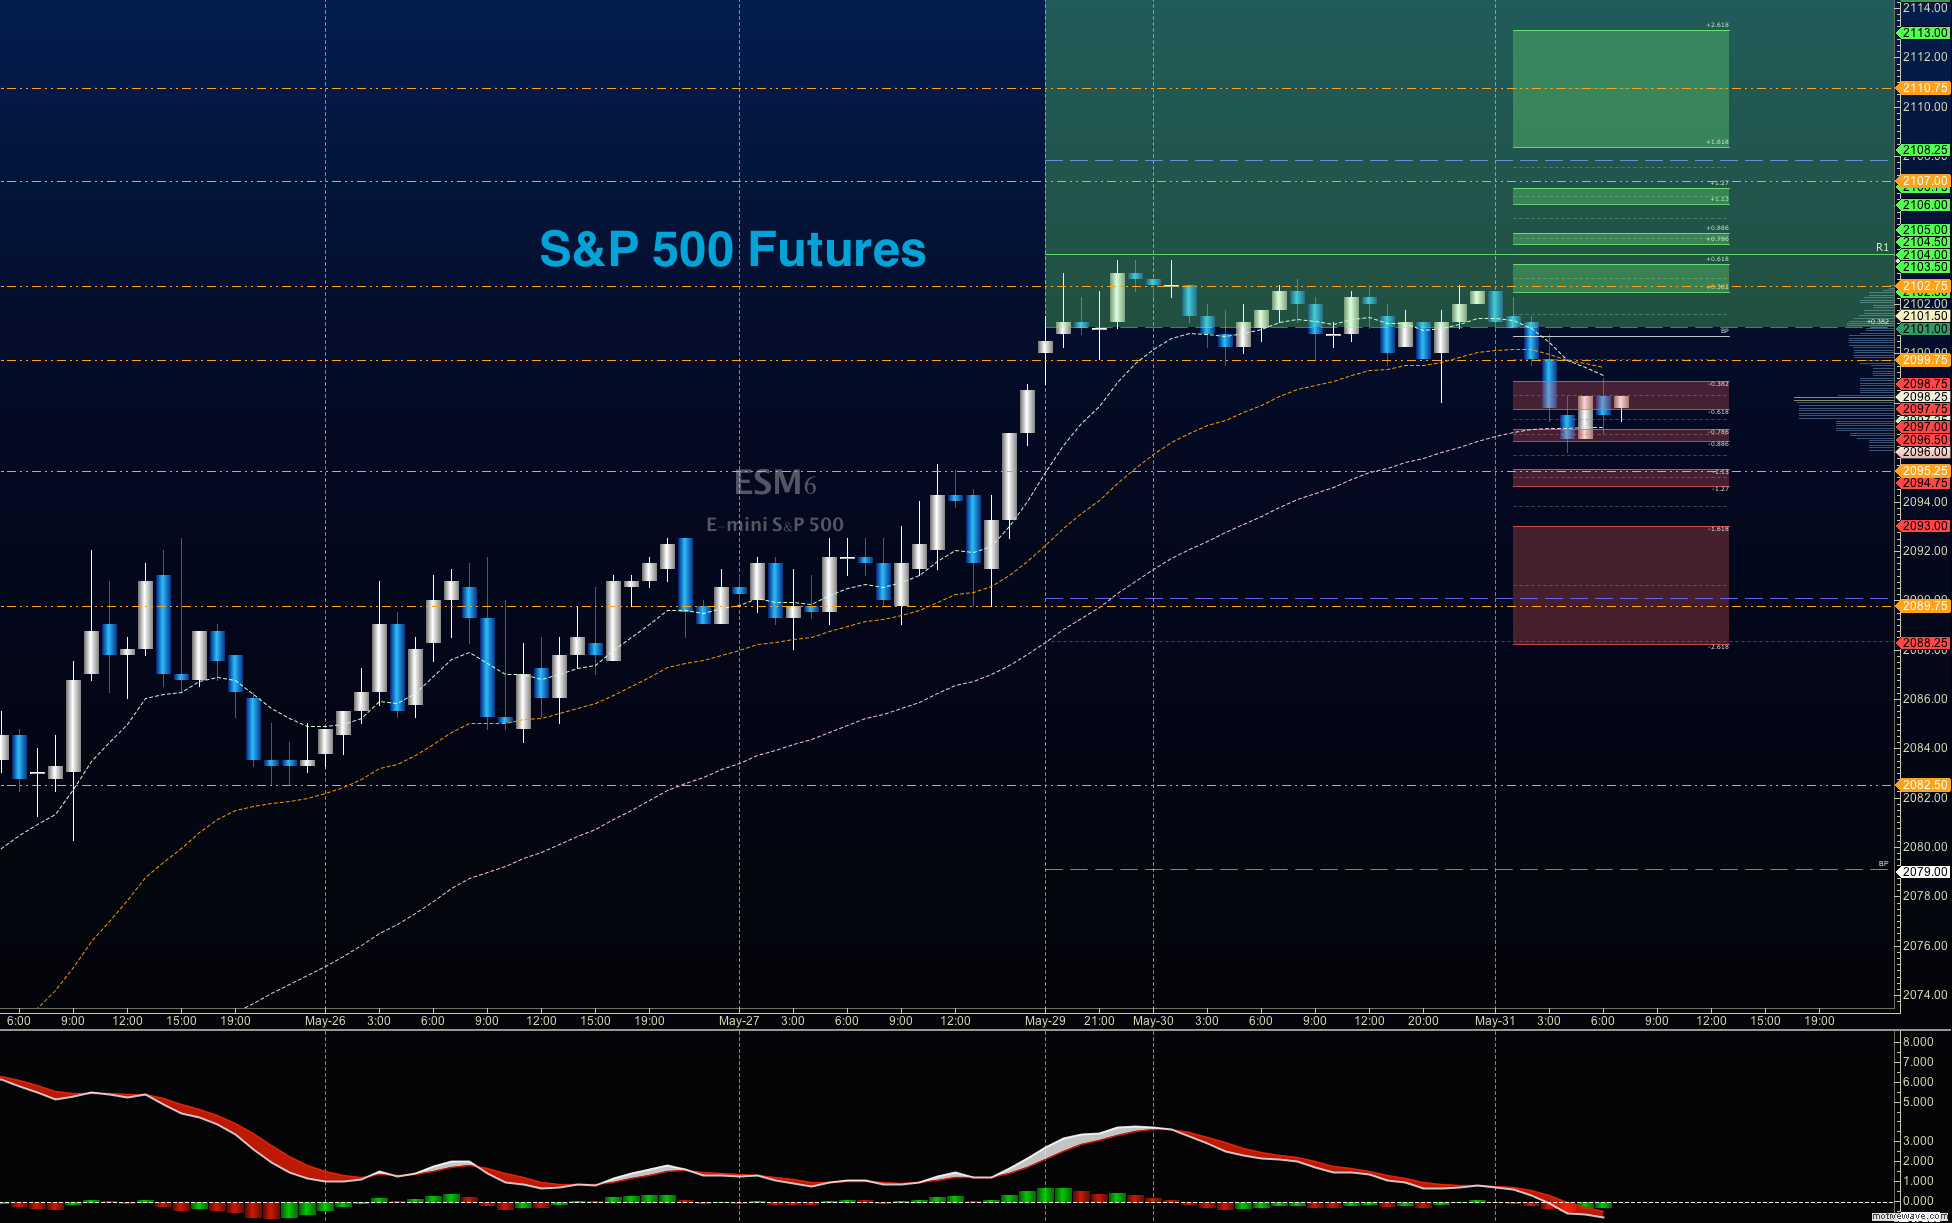
Outlook for S&P 500 futures for May 31, 2016 – Momentum continues to hold strong and sits with the buyers for yet another day. We are testing frontline support near 2096 and holding, but the failure to breach 2099.5 will suggest another drift into deeper support today. Pullbacks are still very likely to be bought, so high congestion area retests will come in as solid spaces for buyers to step in.
Upside trades – Favorable setups sit on the positive retest of 2096, or a positive retest of 2101.5 with positive momentum. I use the 30min to 1hr chart for the breach and retest mechanic. Targets from 2096 are 2098.5, 2099.75, and if we can catch a bid there, we could expand into 2101.25, 2103.75, and 2105.25 to 2109.5. A retest of these levels that hold will press the chart into resistance ahead near 2112.75, which should present as a very difficult level to breach at this time. I do not expect this ES_F chart to expand and hold above 2105 today without a fight, so I expect a failed upside test there on the first pass and will be looking for buyers in their attempt to gather strength and move over the level.
Downside trades- Favorable setups sit below the failed retest of 2098.5 or at the failed retest of 2102.5 with negative divergence. It is important to watch for higher lows to develop with the 2102.5 entry, as strength of motion still sits with the buyers. Retracement into lower levels from 2102.5 gives us the targets 2098.5, 2096.5, 2094.25, 2092.25, 2089.5, 2086.75, 2085, 2078.5, and perhaps a move back to 2076.
Have a look at the Fibonacci levels marked in the blog for more targets.
Oil
Outlook for Crude Oil futures for May 31, 2016 – Oil prices continue to build acceptance near this 49 region, and after a brief pullback on Friday, the chart been steady and chopping in the region between 48.9 and 49.8. With momentum mildly positive, it is likely that oil remains range bound, with the edges of the formations providing the best execution spaces. Deeper pullbacks into support will likely be bought and big spikes upward into resistance sold.
The trading range for oil suggests support action near 48.4, and resistance behavior near 49.94.
Upside trades on crude oil futures can be staged on the positive retest of 49.34, or after a dip into 49.07, but carefully watch for a failure of hold the range near 49.29, if the deep support is taken long. I often use the 30min to 1hr chart for the breach and retest mechanic. Targets from 49.07 are 49.24, 49.45, 49.74, 49.97, and 50.04. If we expand over that, we could see 50.4, 50.65, and even 50.92, but selling pressure holds heavy here today.
Downside trades on crude oil futures continue to setup well below failed retests. Today, this is the failed retest of 49.07, or at the failed retest of 49.7 with negative divergence. These setups give us targets from 49.7 into 49.47, 49.29, 49.17, 49.07, 48.86, 48.73, 48.49, 48.27, 47.97, and perhaps 47.64.
Have a look at the Fibonacci levels marked in the blog for more targets.
If you’re interested in the live trading room, it is now primarily stock market futures content, though we do track heavily traded stocks and their likely daily trajectories as well – we begin at 9am with a morning report and likely chart movements along with trade setups for the day.
As long as the trader keeps himself aware of support and resistance levels, risk can be very adequately managed to play in either direction as bottom picking remains a behavior pattern that is developing with value buyers and speculative traders.
Twitter: @AnneMarieTrades
The author trades stock market futures every day and may have a position in mentioned securities at the time of publication. Any opinions expressed herein are solely those of the author, and do not in any way represent the views or opinions of any other person or entity.

 Rolling Over At Key Fibonacci Level?")


