Friday’s trading saw the stock market indexes accelerate into levels well above normal resistance zones under negative divergence so this morning’s drift down should not be a surprise. That said, S&P 500 futures are holding new price support levels that were previously resistance levels.
The Morning Report: Can S&P 500 Futures Hold Above New Support?
The region between 1914-1917 is very likely to be tested by S&P 500 futures. But if the lower level is lost, 1904-1906 will be the next big test.
Market pullbacks still seem to be buy zones with the key level to hold near 1902.25 for now. Longer time frame resistance levels are sitting now at 1921, 1934, 1939.5 and 1942 -1947 (that is a messy congestion patch).
Intraday resistance on S&P 500 futures sits near 1934.5. Intraday support sits at 1917 – watch this region – it will give us clues as to moves ahead. Deeper pullbacks should continue to be bought – I’m expecting to see higher lows, and expansions upward that will likely be sold at higher highs. Trading on the S&P 500 futures is seeing jagged ranges, but higher lows are the key.
Shorter time frame momentum indicators are sitting in neutral to positive territory. Longer cycles are downward trending but lifting – this means larger upside resistance tests should be sold.
See today’s economic calendar with a rundown of releases.
THE RANGE OF TUESDAY’S MOTION
Crude Oil Futures (CL_F)
Crude Oil futures moved higher with the markets on Friday (in general) under divergent momentum and is also retracing with the broad market. We are back at familiar contention levels of 32.7-32.8 as I write.
Crude Oil futures trading ranges are between 31.16 and 34.4, with 32.6-32.9 being an important test region that buyers and sellers are in a battle to hold. I suspect a move into the 31.7 level but there may be a bigger dip as it tests regions of older support.
Moving averages in crude oil are still negative but losing steepness on longer time frames while holding bounces into higher lows. This will give buyers confidence in moving forward. Deeper pullbacks are very likely to be bought.
Intraday long trade setup suggests a long off 32.57 or 31.73 (with momentum showing positive, else that brings a lower high) into 32.9, 33.4, 33.8, 34.2, 34.8, and perhaps 35.1
Intraday short trade setup suggests a short below a 32.4 failed retest or a failed retest of 33.24 with negative divergence showing sends us to 33.05, 32.7, 32.57, 32.25, 32.2, and 31.74. Momentum on longer time frames remains negative but flattening and still somewhat divergent as we move north.
E-mini S&P 500 Futures (ES_F)
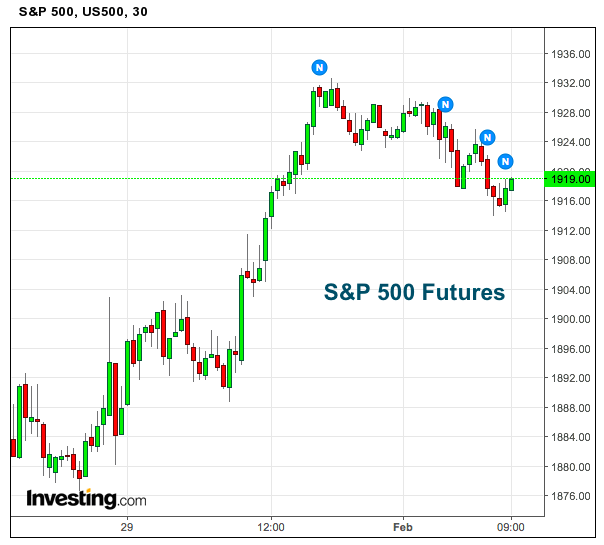
The S&P 500 futures chart is holding steady near breakout levels. A region of importance remains near 1914-1917.
Upside motion has the best setup on the breach of and positive retest of 1917.5 – or a retest after expansion above 1929. We could also consider the breakout above 1925 but be ready to take profit as it expands into 1929 at the first pass. S&P 500 futures targets above 1925 would be 1928.75, 1931.25, 1934.25, 1937.75, 1940.5, and 1942.5.
The biggest overhead resistance test sits at the price region between 1927.75 -1929.5. The chart could expand under positive strength into 1947.75 and higher if momentum lifts. Be careful- watch the higher lows to keep you on the right side of the trade.
Downside motion opens below the failed retest of 1914.5 or at the failure to hold 1932.25 bounce. Retracement into lower levels from 1914.5 gives us the targets at 1911.5, 1907.75, 1904.75, and perhaps 1902.25.
If you’re interested in the live trading room, it is now primarily stock market futures content, though we do track heavily traded stocks and their likely daily trajectories as well – we begin at 9am with a morning report and likely chart movements along with trade setups for the day.
As long as traders remain aware of support and resistance levels, risk can be very adequately managed to play in either direction as bottom picking remains a behavior pattern that is developing with value buyers and speculative traders.
Twitter: @AnneMarieTrades
The author trades stock market futures every day and may have a position in mentioned securities at the time of publication. Any opinions expressed herein are solely those of the author, and do not in any way represent the views or opinions of any other person or entity.


