Today I thought I’d share a few of charts of interest for equity traders. One chart looks at the recent S&P 500 Bollinger Bands contraction which suggests the possibility of a decent move in the stock market. The two others look at the CBOE Volatility Index (INDEXCBOE:VIX) and suggest the potential for a pickup in volatility. The latter two charts usually mean a downside move for the markets…
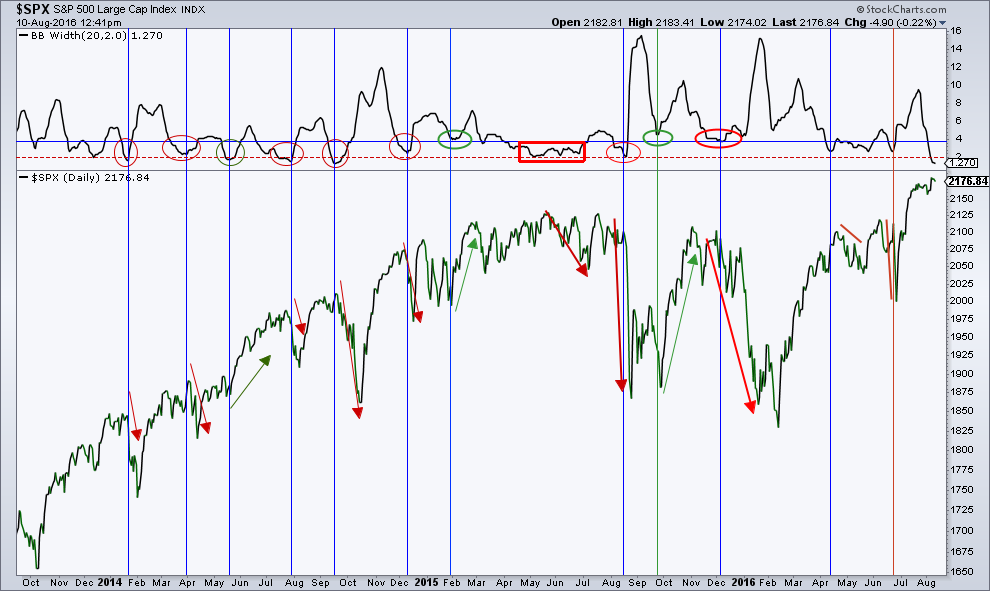
That said, there isn’t a topping formation in the S&P 500 (INDEXSP:.INX) yet so measurements are tough. In addition, market topping activity tends to last, weeks, sometimes months. Just be prepared for some excitement in what has been an incredibly boring tape. I’m still looking for a backtest of the 2,120/2,135 area on the “500.” Ideally, this last wave could still extend to 2,200+ before we get any meaningful downside.
A look at recent August returns certainly gives traders the data (and precedent) for a decent sized move: 2015 (-6.3%), 2014 (+3.8%), 2013 (-3.1%), 2012 (+2.0%), 2011 (-5.7%), 2010 (-4.8%).
The recent S&P 500 Bollinger Bands contraction is quite severe. They say never sell a dull market short. Well, it often leads to pullbacks in uptrends and sideways markets.
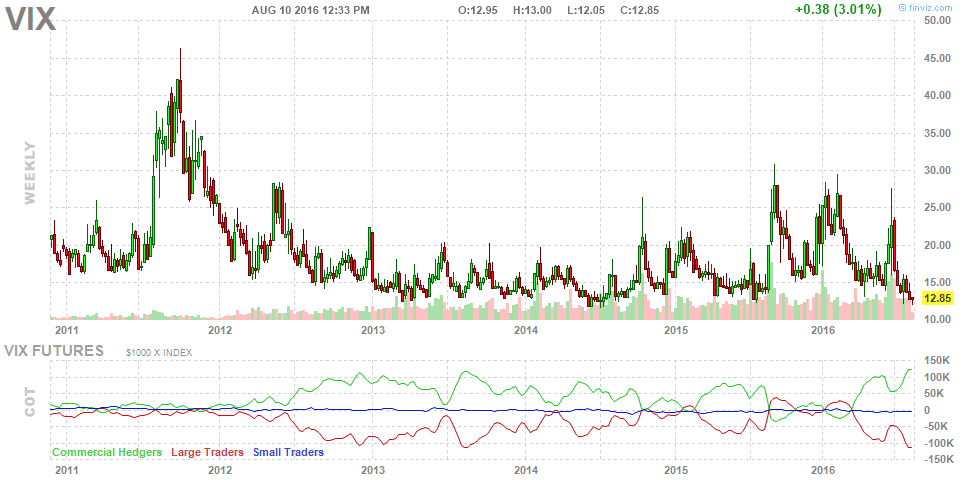
Smart money commercial hedgers are betting on a pickup in volatility (lower market) while not-so-smart large speculators are looking for lower volatility and higher prices. It generally pays to follow the smart money.
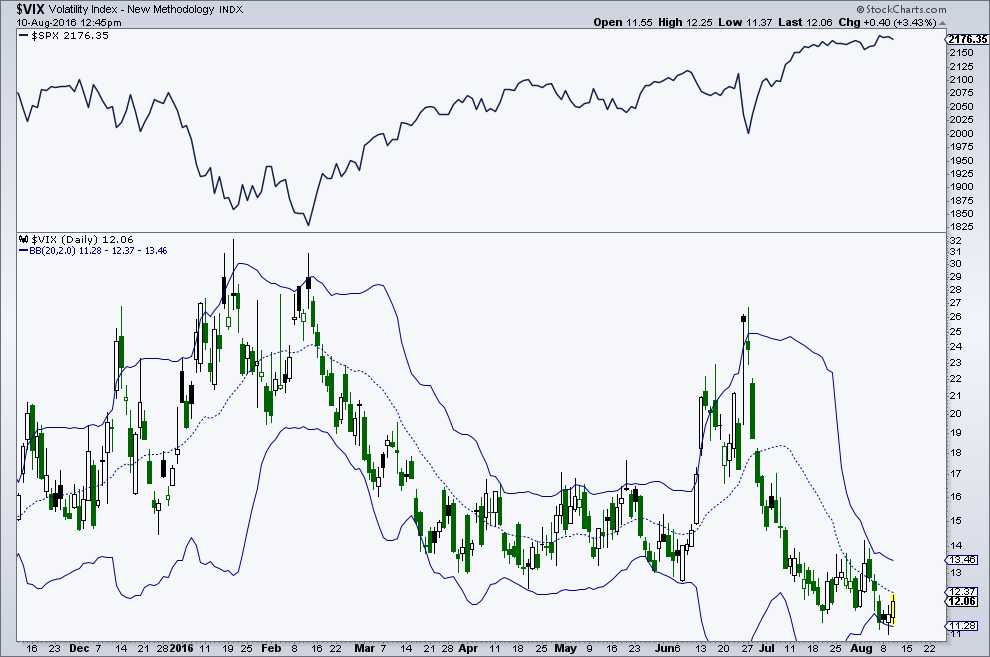
A VIX buy signal generated at yesterday’s close. This is a 3-step process: VIX closes below the lower Bollinger Band, then closes back inside the lower band, then closes higher on the 3rd day. A VIX buy signal is an S&P 500 sell signal for the short- to intermediate term.
In my opinion, it’s a good idea to write covered calls on existing positions and/or reduce stock allocation until this situation resolves. This is a shorter term call (outlook) and my bull market targets of 2,300 – 2,500 for the “500” remains unchanged.
You can contact me at arbetermark@gmail.com for premium newsletter inquiries.
Thanks for reading.
Twitter: @MarkArbeter
The author has position in the S&P 500 and related securities at the time of publication. Any opinions expressed herein are solely those of the author, and do not in any way represent the views or opinions of any other person or entity.
 Ready To Break Out?")


 Ready To Break Out?")
")