S&P 500 Technical Review & Stock Market Outlook For October 21
Here’s a look at some key stock market indicators and emerging themes that I am watching in my latest S&P 500 Weekly Stock Market Outlook:
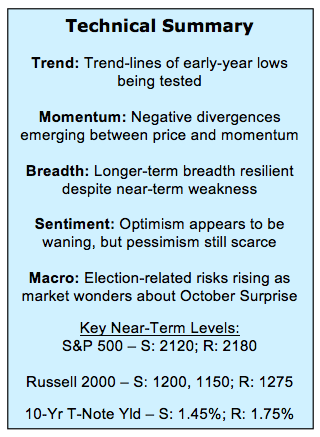
Beyond Range-Bound Indexes, Relative Trends Reveal Leadership – Stocks overall continue to go nowhere but get there quickly, with the S&P 500 locked in a narrow trading range. While the absolute trend has stalled, relative trends showing continued leadership from emerging markets, and emerging leadership from Financials, especially the Broker-Dealers (which tend to be a leading indicator for the market overall).
Short-Term Breadth Trends Argue for Caution – While the S&P 500 has traded sideways for better than a quarter now, short-term breadth indicators continue to argue for caution. Our sector-level trend indicator made another lower low this week, and net new highs on the NYSE+NASDAQ continue to contract. This suggests there may still be downside risk for the indexes as we move toward Election Day.
Evidence of Waning Optimism – Short-term sentiment measures are showing that some pessimism has emerged. The more stable, longer-term measures of sentiment have shown more persistent optimism. That could be changing. This week’s drop in the NAAIM Exposure index caught our attention, as did some of the details that point to increasing bearishness.
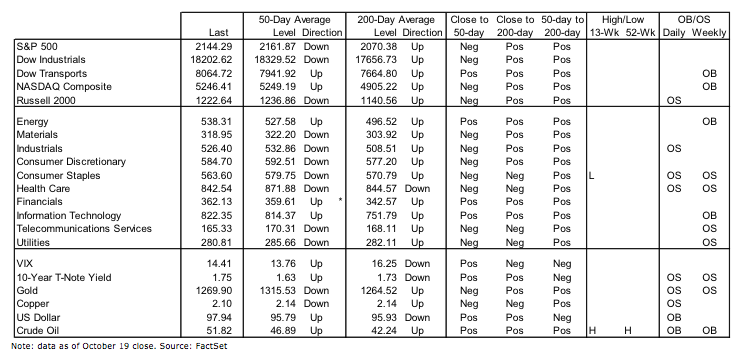
Stock Market Indicators
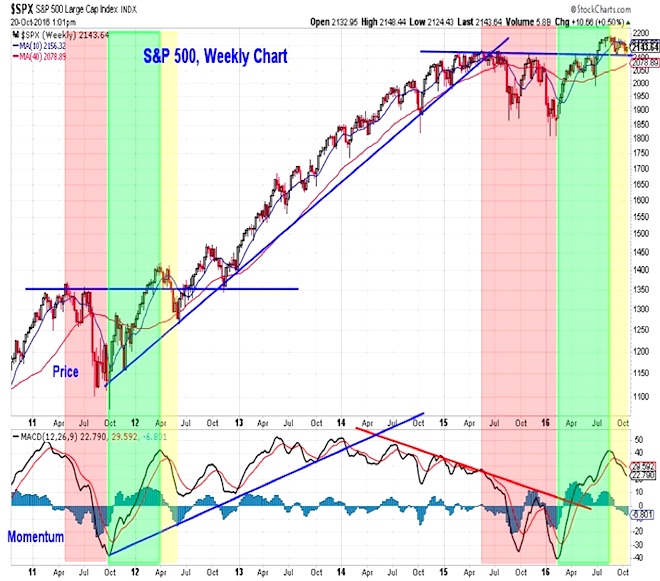
S&P 500 Index
The weekly chart of the S&P 500 shows the index continuing to consolidate above the levels that acted as significant resistance during 2015 and the first half of 2016. While price has moved sideways, momentum has moved lower. This is consistent with the pattern that emerged in 2011-12. Using that period as an example, a move below the breakout level (near 2100) could be the catalyst for a final washout and set up a more stable base from which a possible year-end rally could emerge.
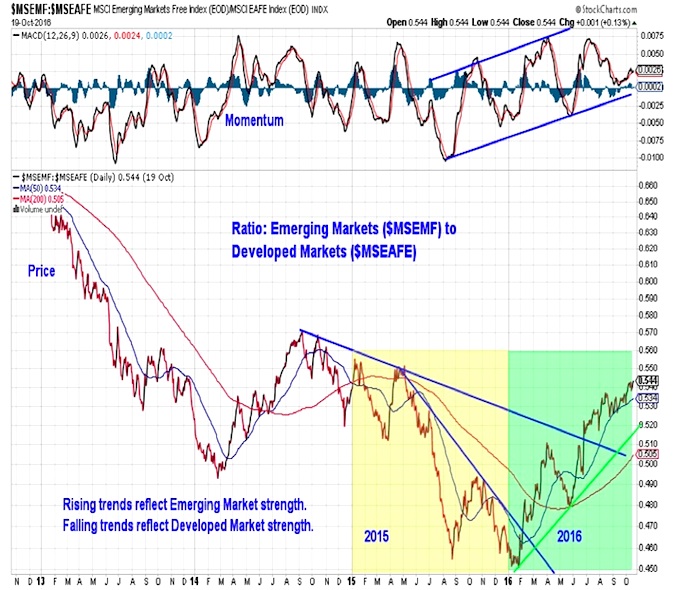
Emerging Markets
Emerging Markets (NYSEARCA:EEM) continue to make new highs relative to their develop counterparts (even if the absolute trend has stalled somewhat in recent weeks). The strength in the relative price trend is supported by momentum, which has turned higher within a well-defined trend channel. Chart looks at MSCI Emerging Markets Index
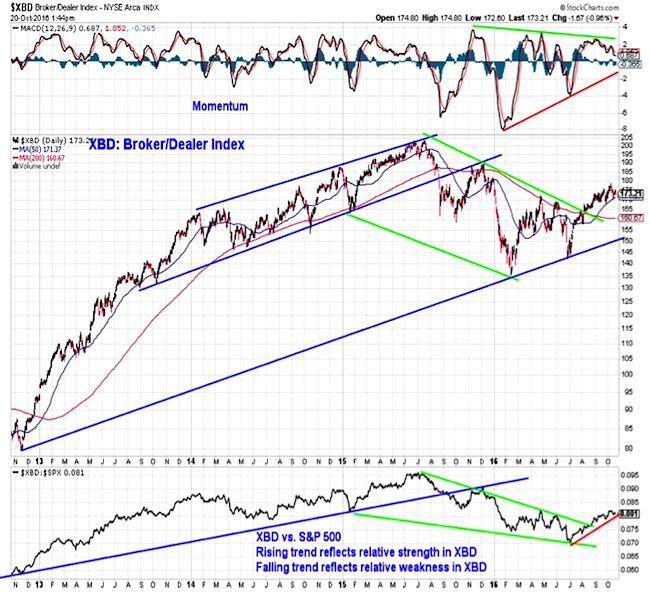
Broker Dealer Index
The Broker/Dealer Index typically acts as a leading indicator for the market overall. The relative down-trend in XBD that emerged in 2015 was consistent with an S&P 500 that experienced a cyclical bear market (based on degree & duration criteria established by Ned Davis Research). The relative and absolute turn higher by XBD this summer is an encouraging indication that stocks have moved back into a cyclical bull market (even if the ongoing consolidation in the broad averages obscures this trend).
continue reading on the next page…
 Rolling Over At Key Fibonacci Level?")


