 The first sign of relative weakness in the equities market showed up in the form of risk-off for high beta stocks. These included small cap stocks, and select momentum names and sectors, such as Biotech. And this created some glaring divergences, while disturbing market breadth. But the broader market shook off this bout of internal weakness and continued its move higher, recently on the heals of small cap stocks. In this vein, I’m watching the Russell 2000 (RUT) for clues.
Will its rally continue? Or will it fade again, but this time taking larger cap names with it?
Let’s take a closer look at the index (see charts below). Here are 4 things that I am watching closely:
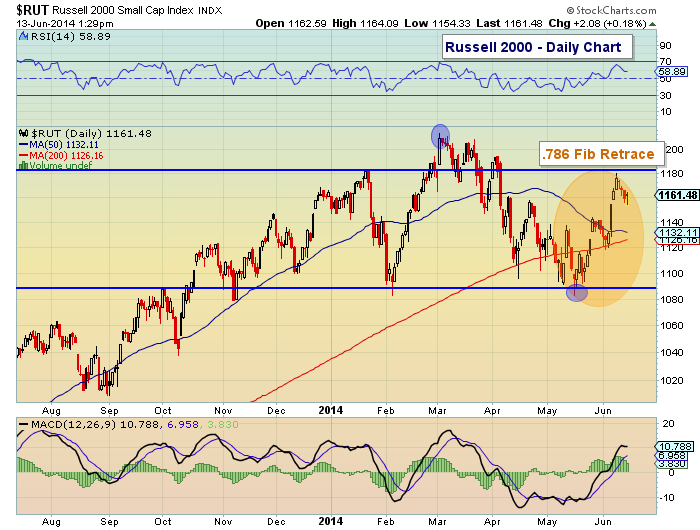
- Key Fibonacci Level. The RUT reached up near its 78.6% Fibonacci retracement (1184) on Monday before fading this week. This resistance level will be worth watching if small cap stocks attempt to move higher again. Note it is also part of a broader head and shoulder pattern.
- Measured Move? The recent bounce higher from the May lows has the look of an A-B-C measured move, making the 1180-1185 level all the more important.
- The 50 and 200 day moving averages are converging. RUT needs to firm up soon to keep its 50 day MA from crossing below the 200 day MA (which would be bearish).
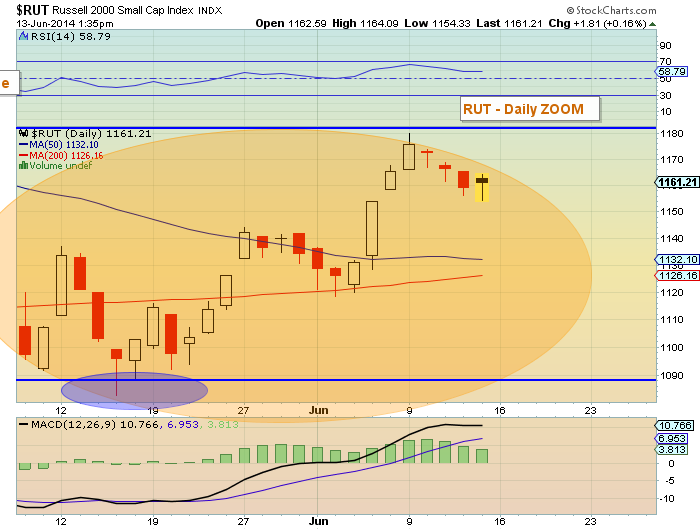
- Flag formations. The recent fade has produced a similar flag to that of late May. Holding today’s lows would be a great way of keeping that bullish continuation pattern alive.
Russell 2000 Daily Chart – June 13 2014
Russell 2000 Daily “Zoom” Chart – June 13, 2014
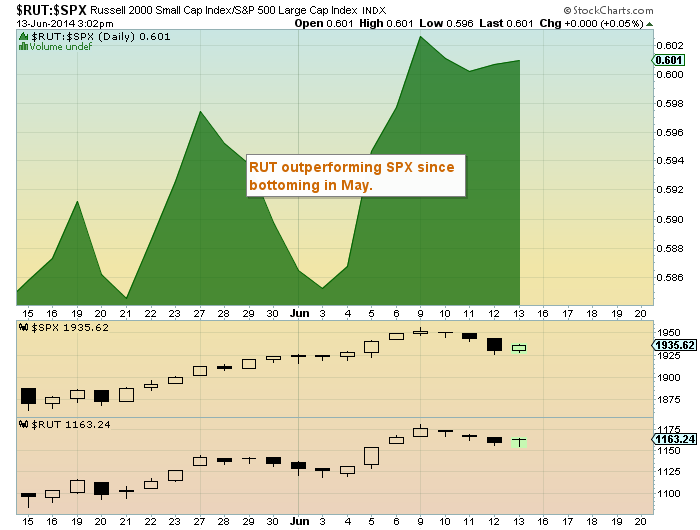
One last chart to share… This one looks at the Russell 2000 outperformance since its bottom on May 15th. Considering the deep divergence with the S&P 500 (SPX) in March and April (and still glaring on a macro basis), the recent outperformance is in line with its rebound rally. That said, stock market bulls would like to see small cap stocks continue to outperform.
Russell 2000 (RUT) : S&P 500 (SPX) Chart
Thanks for reading. Trade safe.
No position in any of the mentioned securities at the time of publication. Any opinions expressed herein are solely those of the author, and do not in any way represent the views or opinions of any other person or entity.


")

")

 Rolling Over At Key Fibonacci Level?")