 I’ve been tracking the fall in Silver prices for some time now. On August 24th, 2014 I wrote a post on See It Market about why Silver is losing its luster (i.e. heading lower). In that post, the focus was on two key support levels that gave way and technically weakened silver futures appreciably.
Here’s a recap:
- 26.87 as 1st support (broke)
- 21.455 as 2nd support level (broke)
- These levels were derived from a 20 year, monthly chart and had held for 18 months and 2 months, respectively.
- This derived a longer-term target of 14.095
So let’s see where silver is trading now and how much damage was done by those two support levels not being able to hold.
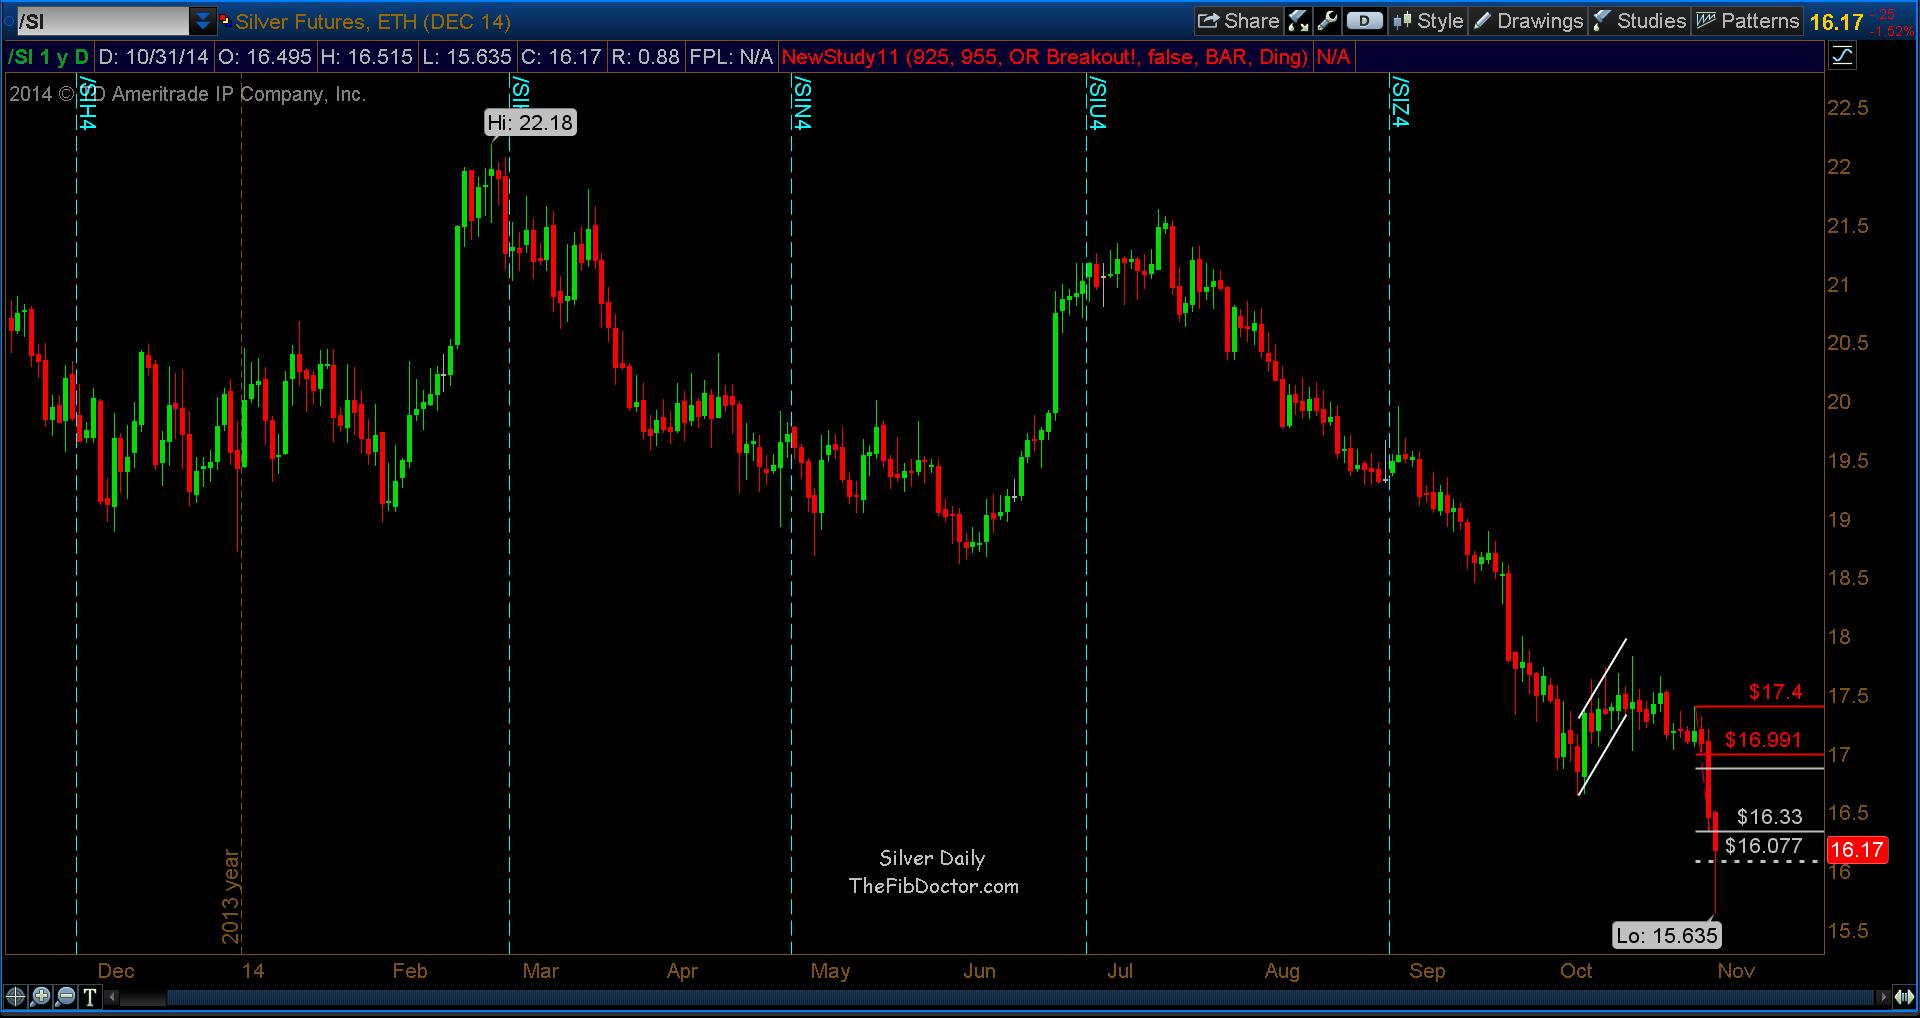
In the chart below you can clearly see Silver continue to weaken, notwithstanding the noticeable buying late last Friday. Here’s a few key technical points that I’ve been tracking:
- A bear flag formed and played out.
- The current target is 16.08 and has been hit but isn’t closed.
- The longer-term target of 14.095 is still valid.
- Price would have to close above 16.995 in short order to give any validity to Friday’s (10/31/2014) buying.
Silver Futures 1 Year Daily Chart
Note that active investors can also track silver via its popular ETF, the iShares Silver Trust (SLV).
No position in any of the mentioned securities at the time of publication. Any opinions expressed herein are solely those of the author, and do not in any way represent the views or opinions of any other person or entity.
 Ready To Break Out?")


