The upcoming ECB policy meeting is arguably the most anticipated since last December’s FOMC where it was widely expected the Fed would begin tapering QE.
This time around – amidst persistent signs of deflation and fresh off President Mario Draghi’s comment that “the risks of ‘doing too little’ outweigh the risks of ‘doing too much'” at this year’s Jackson Hole – speculation abounds over what accommodative steps the ECB’s Governing Council will take next. A general consensus has emerged – even though Euro Area Core Inflation persists in the “Danger Zone” below 1% – that the ECB hasn’t quite put full-blown QE on the table yet (see here, here and here). 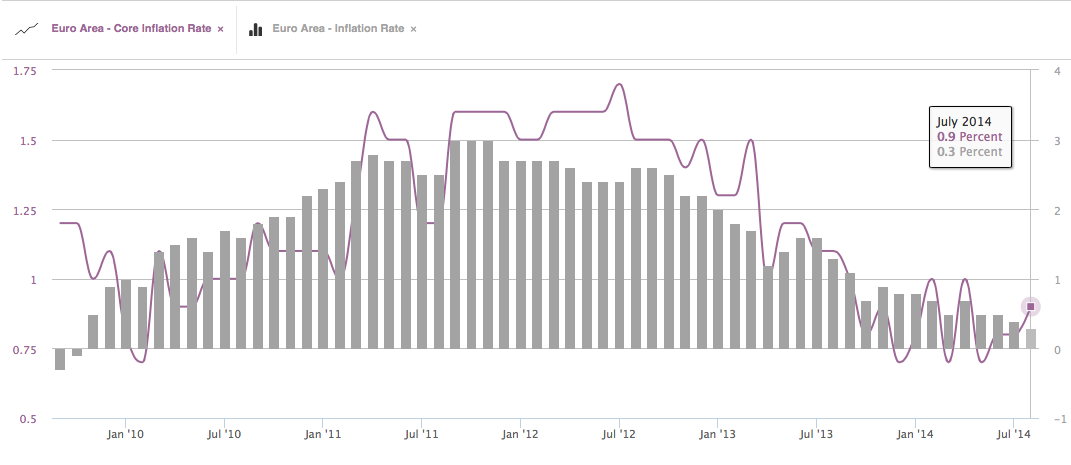
Instead, Draghi and Co. may choose to enhance the new TLTROs program due to launch in mid-September, further cut benchmark lending rates (even while Draghi notes they are at “the effective lower bound“); or even pursue private QE with the purchase of Asset-Backed Securities (ABS).
This context is valuable for informing EUR/USD’s medium-term macro backdrop. The Euro made a major bottom in July 2012 at 1.2041, just as Euro Area Core Inflation hit a cyclical high at 1.7%. From then until Spring of this ear, the EUR/USD rallied steadily; meanwhile, deflationary pressures continued to take on steam.
Finally during the ECB’s May, 8 2014 meeting, the EUR/USD topped – during the meeting – as Draghi’s masterfully dovish performance triggered a selloff versus the USD that has hardly abated in the 4 months since. In fact, for only the third time in its history EUR/USD just completed a run of 7 consecutive negative weeks – fact made all the more interesting by the ECB’s policy decision because neither of the previous runs – ending in November 1999 and February 2010 – made it to 8. The ECB may choose to stay its accommodative hand; but will the EUR/USD make history?
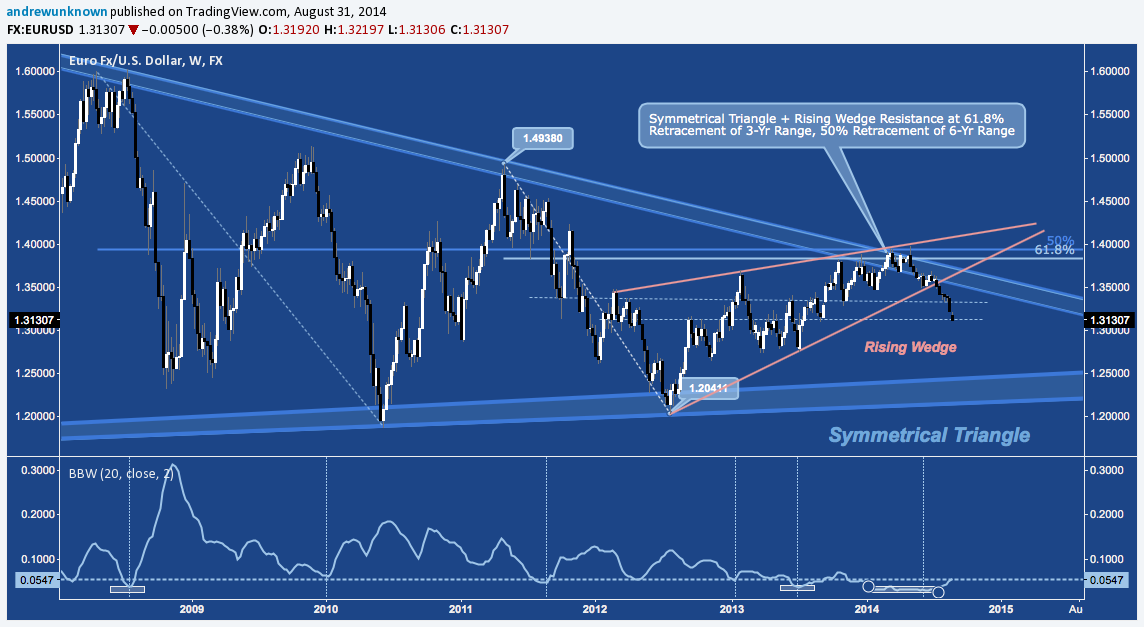
Given the growing policy disparity between the ECB and (only relatively) hawkish Fed, EUR/USD continues to trade intuitively. The 7-week run referred to above triggered with EUR/USD’s mid-July breakdown from the 2-year rising wedge support (orange). Horizontal support is present below – nearby at 1.31 and distant at 1.28 – but overall there are few technical footholds to give the pair bullish traction before symmetrical triangle support near 1.22-1.23, some 800-900 pips below. If that sounds like an improbable move, consider the Bollinger Bandwidth in the bottom panel, below: EUR/USD is just emerging from the quietest period in its 15 year history. Range expansion and volatility may just be getting started.
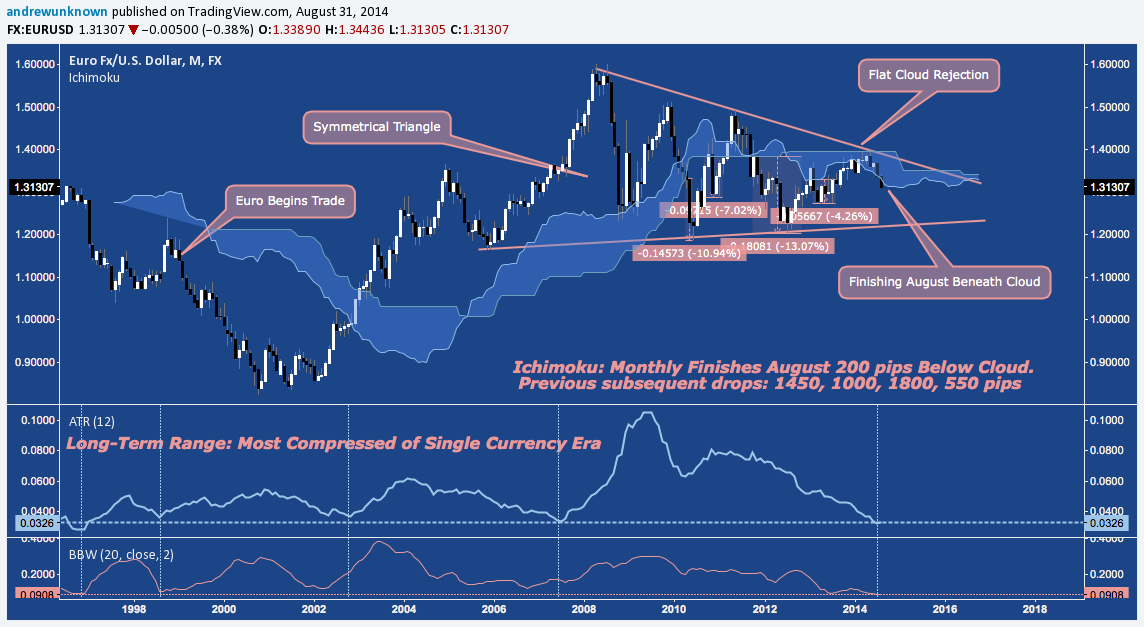
How much range expansion, Ichimoku Kinko Hyo’s kumo (“cloud”) on EUR/USD’s monthly chart provides some insight. The ECB’s May meeting occurred just EUR/USD tested flat cloud resistance (typically the most formidable kind). 4 months later, August is closing below the cloud. A continuation is by no means assured, but the Euro has never been this compressed during the Euro era; and the last 4 major rejections from the monthly cloud produced drops of 550-1800 pips with EUR/USD currently trading only 200 below.
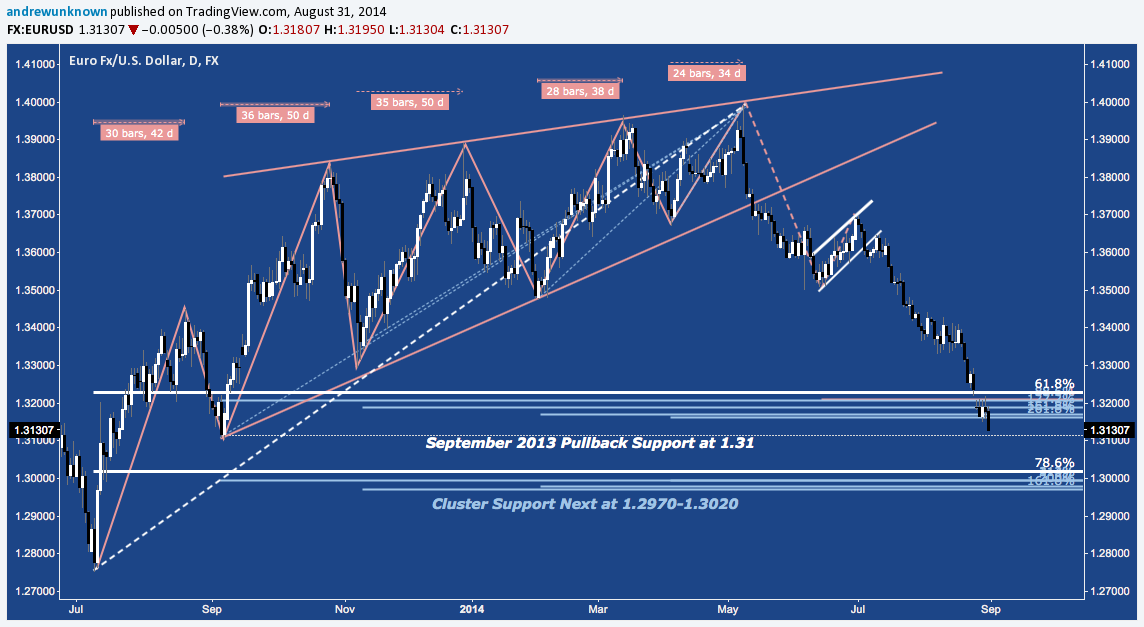
That said, nothing moves in a straight – and what looks comparatively linear on a monthly chart is usually anything but on a weekly or daily timeframe. The daily chart below offers a closer look at the rising terminal wedge that developed on EUR/USD since it’s local bottom near 1.2750 last July; and the violent move that has followed a complacent market’s awakening to the possibility of imminent, radical measures from the ECB.
Last week EUR/USD solidified mid-August’s break beneath November 2013 support near 1.33 with immediate confirmation spurred by Draghi’s Jackson Hole speech, consolidating inside cluster support near 1.32 before selling off to finish lower on Friday. This week the pair opens just above September 2013’s pullback support near 1.31. Meanwhile, major cluster support (and the last foothold before entirely retracing to last July’s low) sits just lower, bracketing round-number support at 1.2970-1.3020.
With these major medium-term support levels situated nearby, could traders great ECB hesitancy to launch ABS or even QE be spark a – at least short-term – Euro rally? A shorter-term view suggests yes. Below I’ve outfitted EUR/USD’s 4-hour (240-minute) chart with an exponential moving average band that alternately illustrates both 1) how uniform the Summer’s downtrend is, and 2) how far EUR/USD has fallen without much reprieve or mean reversion. This heavily extended state almost 1.5% from the band is complemented by a 2-week positive momentum divergence that adds to the these other contrarian intimations this week might post a short-term bottom rather than additional selling.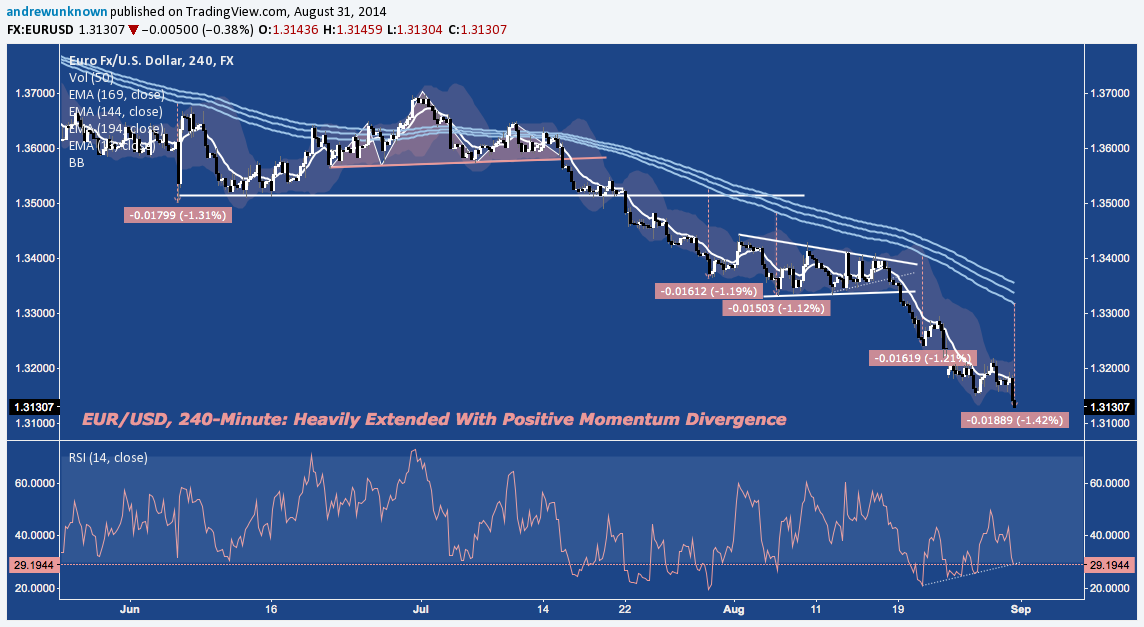
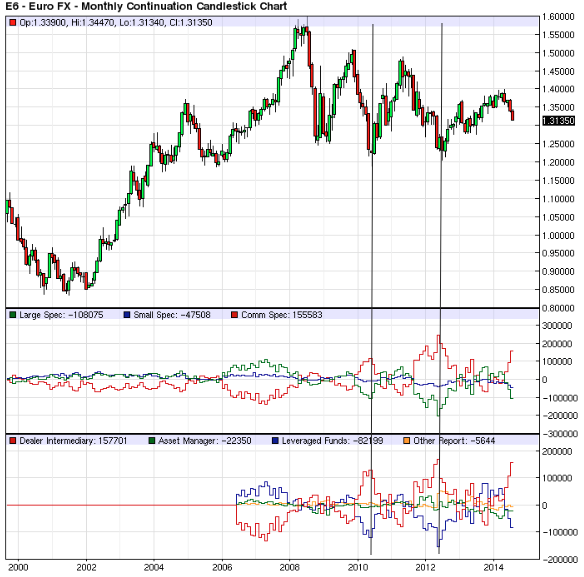
The CFTC’s Commitments of Traders is especially valuable to consult in a context where future volatility is likely to be high and major anticipation over policy decisions is mounting. The latest data from CME’s E6 Euro Currency Futures Contract shows Commercial Speculators have aggressively built up a long hedge over the last year that has more than doubled since May, resulting in a near-record high net long position. On the flip side of this, commercial speculators – especially leveraged funds – are heavily short. This trend could escalate further, but remember that the last two times the market was so polarized – both amidst the slow-motion panic of the Eurozone’s Debt Crisis – EUR/USD popped hard: in 2010-2011 by over 3000 pips across 12 months; and in 2012-2013 by 1700 pips in just 6 months.
Technical considerations aside, if you’re going to pick up pips out in front of the ECB’s steamroller this week, you cannot afford to forget Super Mario’s favorite policy dictum:
Trade ’em well.
On Twitter: @andrewunknown
Author holds no position in securities mentioned at the time of publication. Commentary provided is for educational purposes only and in no way constitutes trading or investment advice. Euro inflation chart courtesy ieconomics.com. Euro statue image via carnegieendowment.org. Nike “swoosh” logo property of Nike, Inc.


