In striking contrast to 2014’s dominant theme of “record low volatility” and the numbingly granular tedium with which it has been analyzed, some US equity sectors and industries have never stopped partying following 2013’s outlying bullish performance. A few have left pundits perplexed (e.g. Utilities continues to outperform it’s sector peers year-to-date), but others are held up as an affirmation that the post-crisis cyclical bull market – now well into its sixth year – is alive and well. One case in-point in the latter category: Semiconductors, where the PHLX Semiconductor Index (SOX) added as much as +21.9% at it’s year-to-date (and 14-year) high on July 16 – exactly triple the S&P 500’s 7.34% performance over the same time frame.
Much like Biotech, Semiconductors have installed massive gains over the last 18 months, especially as momentum flows have gravitated toward “old tech” stocks (ironically, a who’s who list of the speculative darlings that didn’t succumb to 2000-2002’s mass extinction event) outfitted with (relatively) sound balance sheets, massive stock buyback pipelines and ease-of-access to farcically cheap debt markets.
But momentum is a fickle market dynamic. Inherently irrational, animal spirits eschew the concepts of value and relative strength in individual stocks, preferring to indiscriminately bid whole industries into improbable trends that push them to entirely unsustainable levels. That lack of regard for the fundamentals-based heterogeneity that exists beneath the breathless and sloppy generalizations heard among those who are enjoying the party (e.g. “Old Tech is red-hot right now”) is ultimately what sows the seeds for momentum’s abrupt abandonment as flows hemorrhage out with no apparent catalyst in search of greener, unspoiled pastures to graze on. That’s the point where the escalator up becomes the elevator down and an industry that seemed to be under divine protection becomes a falling knife.
Are Semiconductors at that point? As someone who likes to subject established trends to means-testing by counter-arguing their merits, looking for potential telltale cracks in a seamless facade (call it healthy skepticism), I find Semis have entered a very challenging technical context – one where the probability of the industry rolling over in a long-deferred bout of price discovery is high.
The heavily overbought condition the SOX opened July with sets the stage:
$SOX Monthly RSI on NYE 1999? 78.5. Now: 79.6 at Structured Res. No: Nothing to See Here. $SOXX $SMH https://t.co/U636nn0xll
— Andrew Kassen (@andrewunknown) July 3, 2014
As July has wore on, the “Structured Res” located at 630-670 I mentioned has asserted itself, creating a candle that denotes a bearish intra-month reversal:
$SOX Long Time ‘Til August, But Note Monthly Shooting Star-In-The-Making at 7-Yr Butterfly PRZ $SMH https://t.co/xdkQfErPOg — Andrew Kassen (@andrewunknown) July 17, 2014
Here’s a current draw of the 7-Year Bearish Butterfly mentioned above. SOX has run headlong into a confluence of fibonacci/harmonic, 5-year rising wedge and 18 month rising wedge resistance:
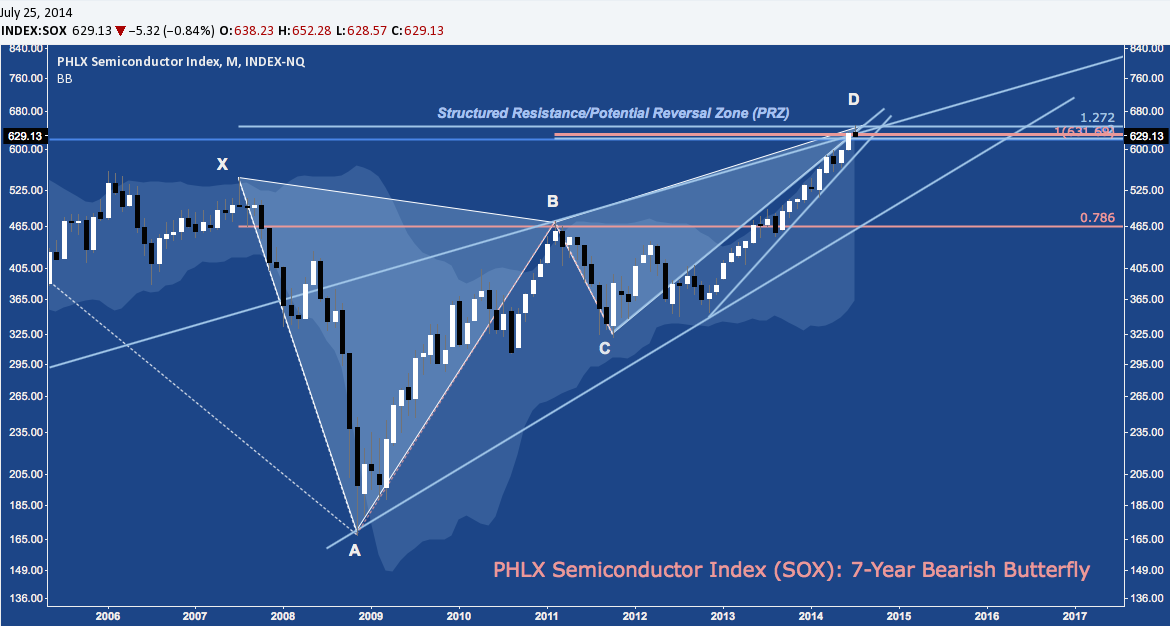
Each of these patterns carry their own measured move targets. Taken together in the context of the Bearish Butterfly, their message is singularly bearish, with the Butterfly itself suggesting a potential drop of well over -20%.
The typical rejoinder here is to affirm the trend by making reference to the late 1990s (as though that’s somehow reassuring) in a logically misguided effort to deploy a textbook asset and sentiment bubble as a sound benchmark from which to argue for trend sustainability. For what’s it’s worth, it is true that the current Semiconductor run is little more faint shadow of the speculative mania that created 1999-2000. But as I mentioned couple weeks ago while discussing the industry as one of the charts to watch during the Summer Doldrums:
This isn’t 1999, true: but just because the market isn’t entering the end-game of a storied speculative mania doesn’t mean it can’t undergo a major reset. Consistently picking tops is nearly impossible; but there is every incentive to pick out potential tops – like this one – and to exercise prudence around them.
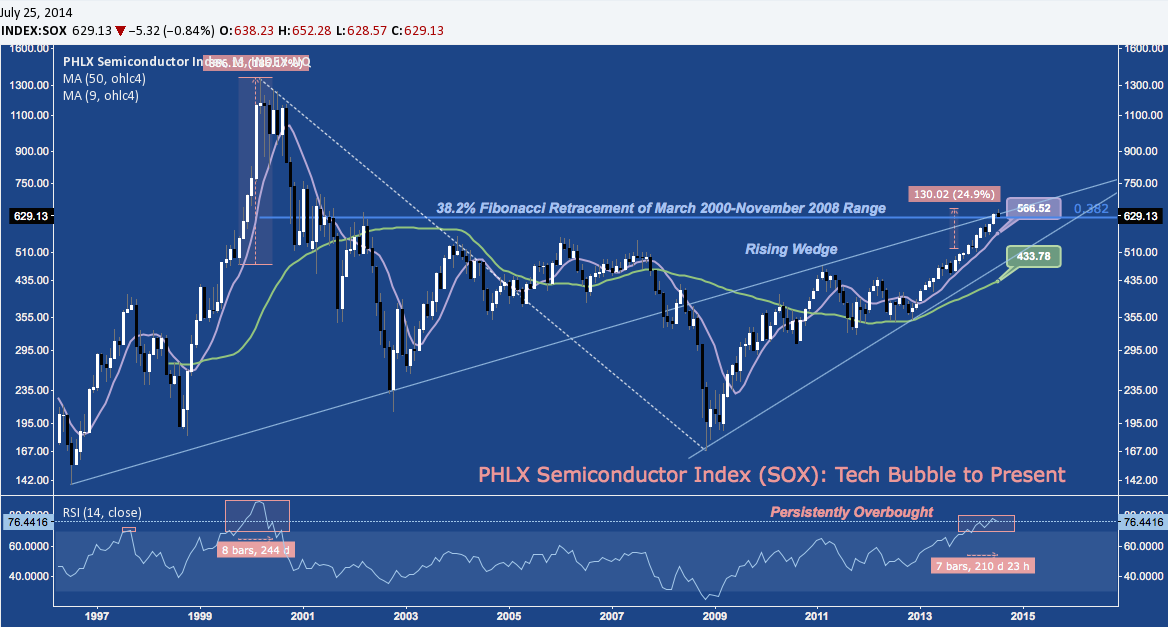
Here’s a quick comparison of the two periods: 1999-2000’s run while the monthly RSI was above 70 was 186%, while today’s is similar in duration but covers only 15% of the range. Both 1999-2000 and 2013-2014 have seen strong support from the 9-period SMA (currently at 566), which I continue to treat as an affirmation of the primary trend up:
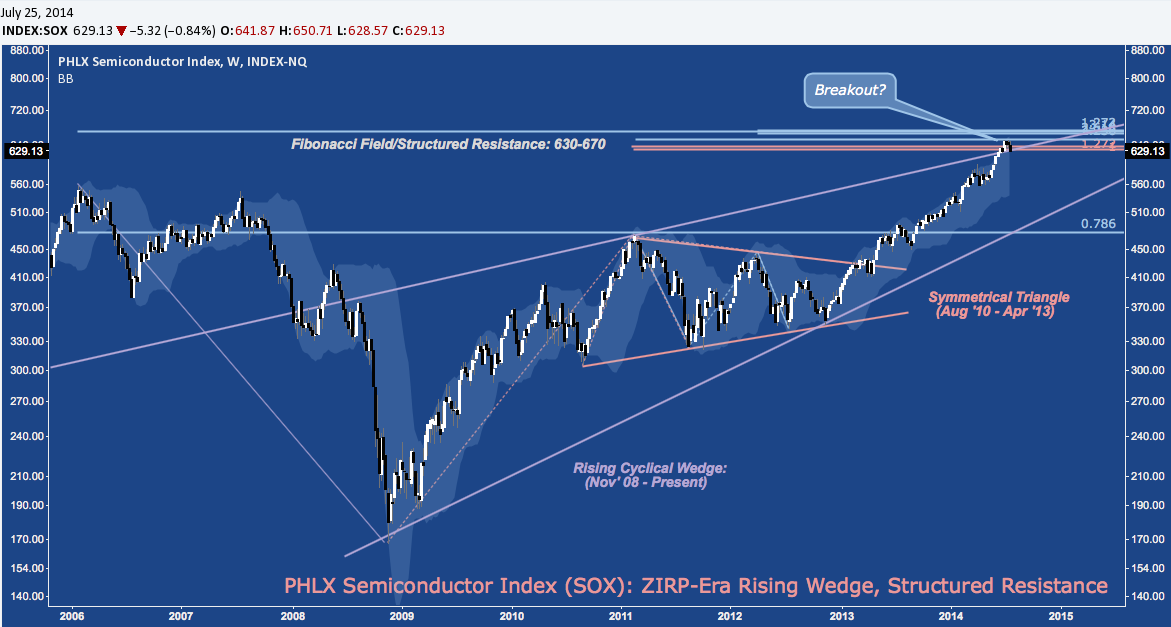
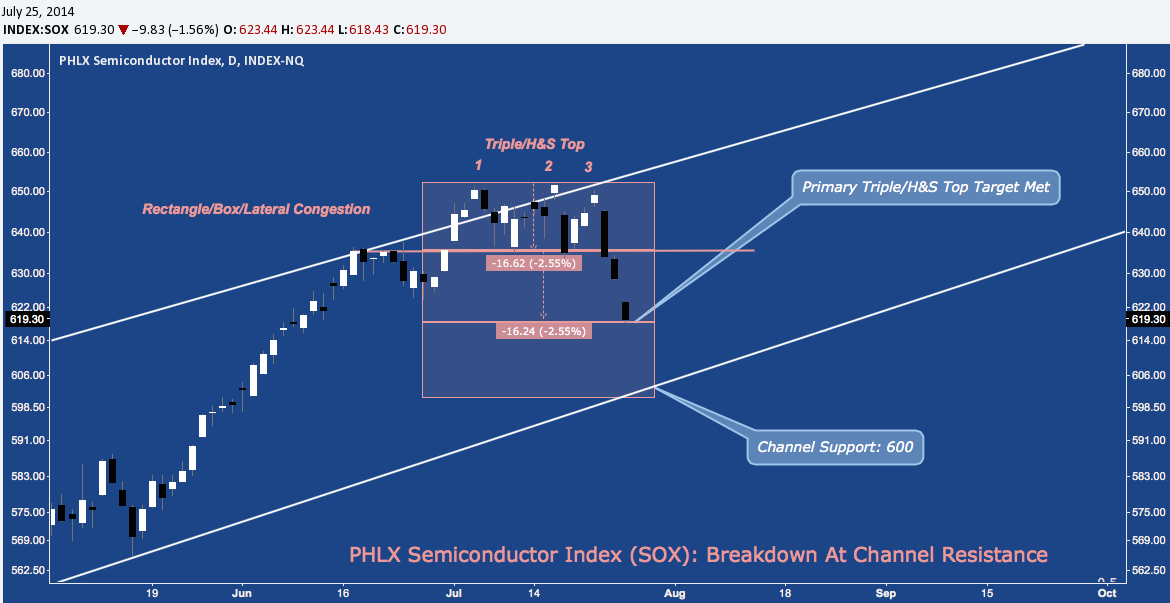
Zooming in on the 6-year rising wedge on the SOX weekly chart, let’s take a closer look at the tentative wedge breakout Semis began July with; and how that break has devolved over the month into failure after tagging structured resistance and a key price objective of 2010-2013’s symmetrical triangle:
Putting a finer point on it, let’s check out the daily. To ward off any confusion, the chart below is a 5-month fractal of the last 5-years depicted in the chart above. To the everlasting consternation of those who doubt the (non-predictive) utility of classic chart patterns, SOX set up a clean Triple Top (yes, they exist) or Head & Shoulders Top pattern at structured resistance here that brought about the wedge breakout failure just described:
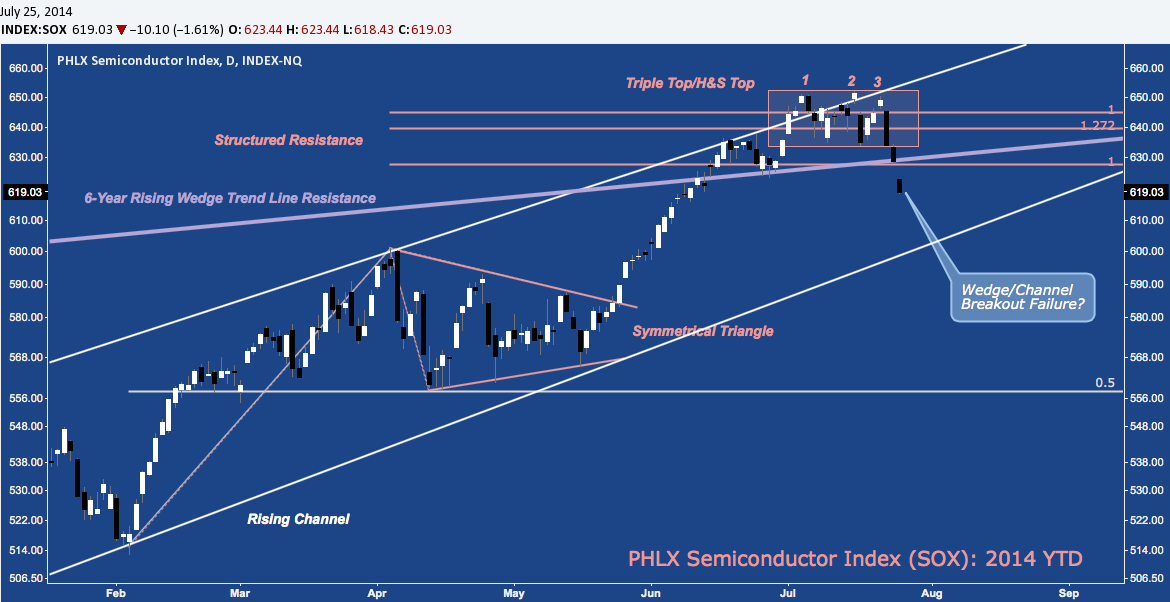
This topping pattern hit it’s primary price target on the open this morning. A duplication of this breakdown takes SOX to 600 and rising channel support.
The SOX is a specialized cap-weighted index, generally comprised of 30 equities of which just the top 2 alone make up nearly 20% of the value. Going “under the hood” to take a look at these major constituents provides further clues about the tone and potential extent of the industry’s sudden weakness.
The largest of these at just shy of 10% is Intel (INTC). Since late 2012, INTC has nearly doubled with more than half of that ground covered in the 6 consecutive positive months (Feb-Jul) it has enjoyed so far this year. Intel is on a huge run; but it’s by no means unprecedented. In fact, as the largest Semiconductor out there Intel is doing what it has always done. To wit, the the 20-month, 81% run it has put in since November 2012 is consistent – by performance and duration – with 7 other major double-digit rallies the stock has churned out in the last 12 years.
Each of those 7 were momentum-fueled; and each suffered a massive setback afterward when interest abruptly shifted away. Sharp pops higher into local RSI peaks have been simple but powerful tells throughout this period that the huge price moves INTC produced were on their last legs. Is this time any different?
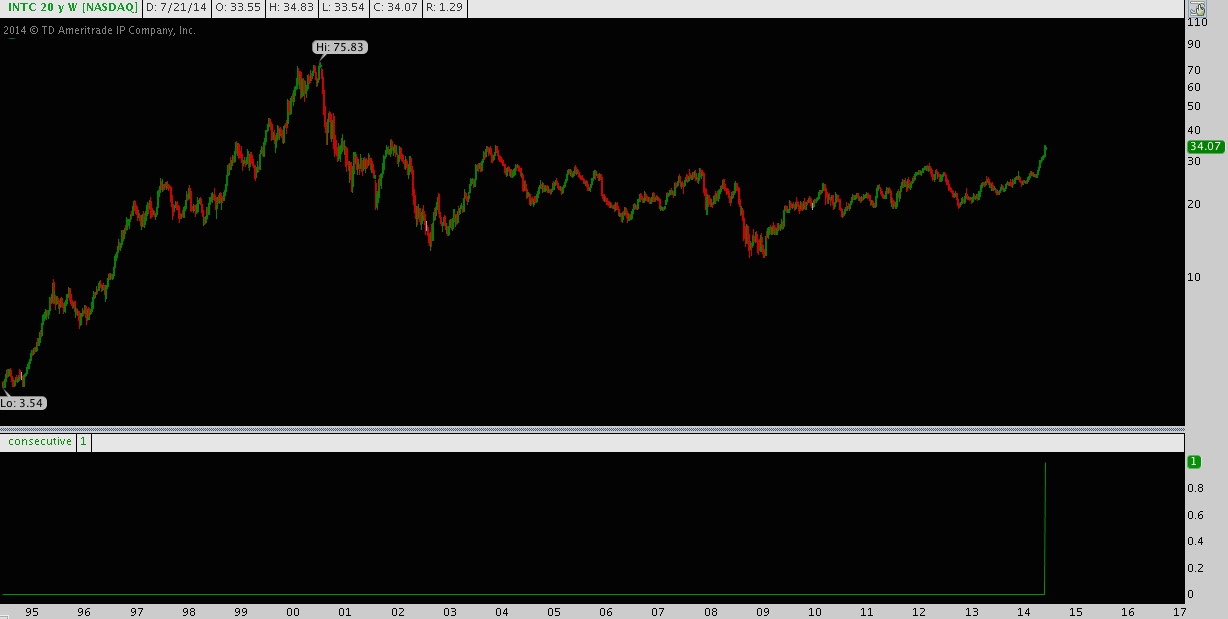
But what about prior to the tech bubble? What bout the tech bubble itself? Since it’s inception as a company, INTC has always had sharp moonshot higher, followed by quick, cratering drops that usually shift into multi-month drifts lower before turning higher. Remarkably, INTC advanced nearly 12000% from 1989-2000 – a testament that young, speculative ventures can prevail and catapult – along with their shares – into spectacularly successful companies. Nonetheless, even during this heady period it was nothing for INTC to forfeit 33-50% of it’s value. This is what Intel has always done, and what it is likely to do again soon.
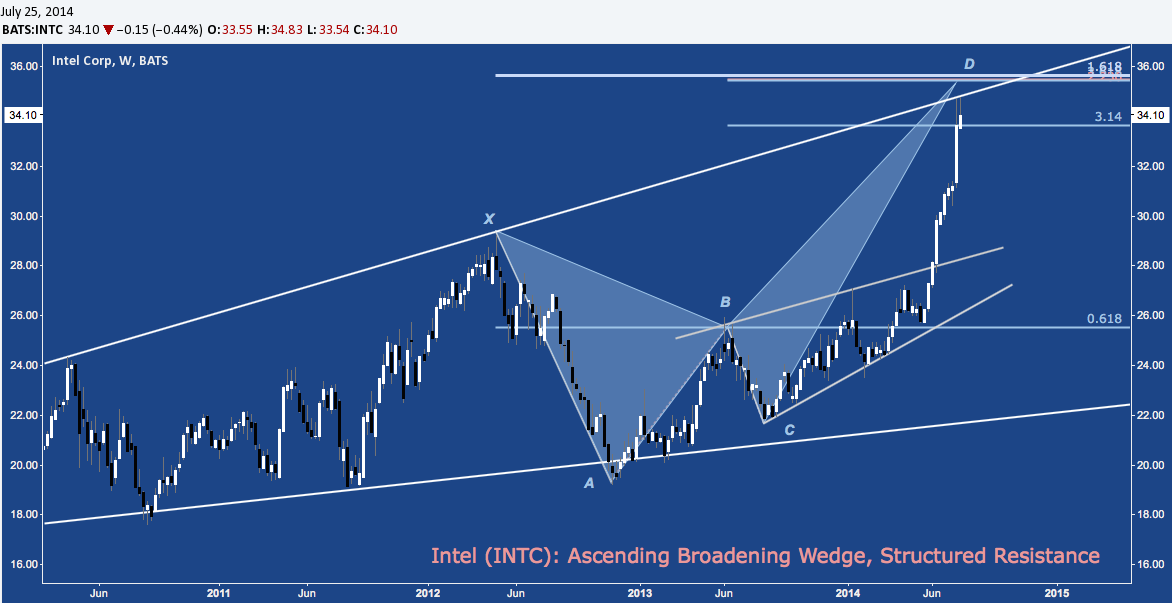
How soon? Given the position of the SOX, I’d say very. Here’s INTC’s weekly chart: note it’s parabolic run is now confronting Ascending Broadening Wedge trend line resistance and cluster resistance (at D).
Does that run look absurdly strong, yet unsustainable? This is the first time ever that Intel has turned out 10 consecutive up weeks in a row, triggering a positive reading on the “10 consecutive weeks up” indicator in the bottom panel, below:
Stats like that can be misleading: after all, strength begets strength and acts as a magnet for flows; but given the position of the broader industry at key resistance, the penchant for reversing into major double digit declines after ramps like this one and the confluence of major technical resistance around $35, INTC looks set to take a major step back: a development that is in no way supportive of the SOX.
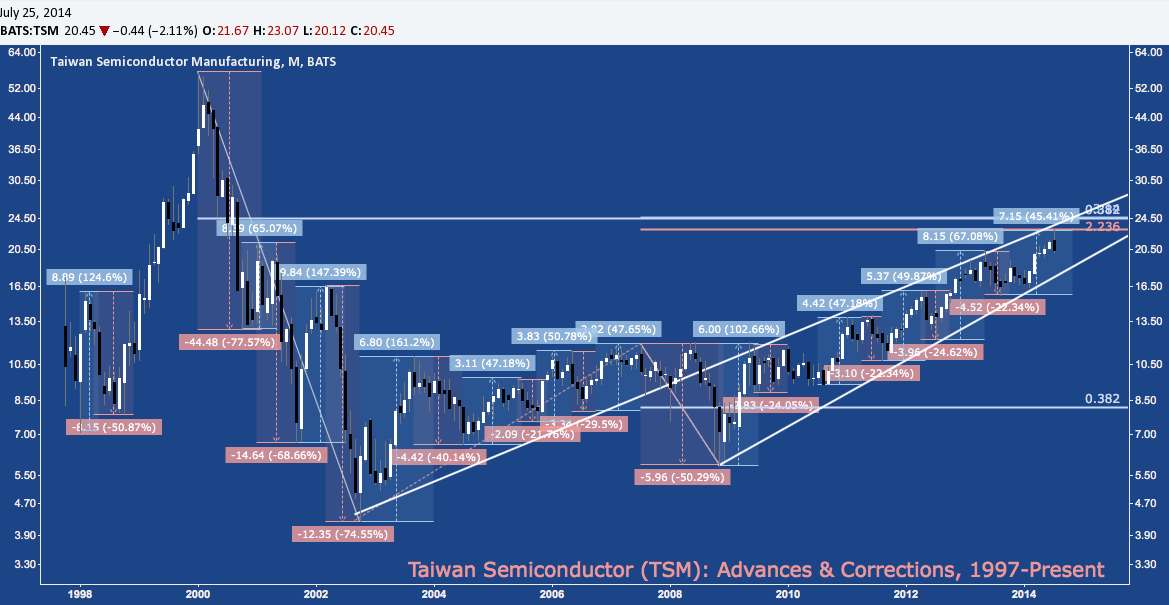
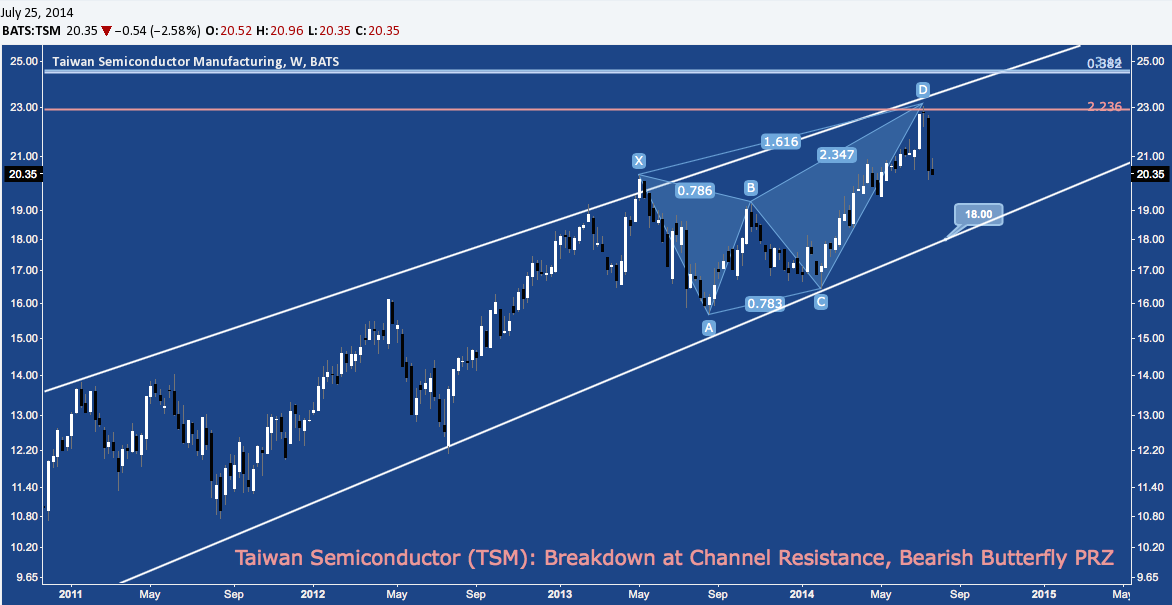
The broadly followed rule-weighted Market Vectors Semiconductor ETF (SMH) deviates from SOX by featuring Taiwan Semiconductor (TSM) at 16% (whereas SOX cap-weights it at 3.9%). Following SMH’s lead first (INT and TSM alone comprise 40% among 24 other holdings) here are the advances and pullbacks TSM has cycled through since the Tech Bubble, much like Intel:
Just like the SOX, TSM is suffering a rejection at 6-year Rising Wedge resistance; here after tagging the Potential Reversal Zone (PRZ) of a 15-month Bearish Butterfly at $23. The Evening Doji Star candlestick pattern built out over July after hitting this PRZ is seeing followthrough this week:
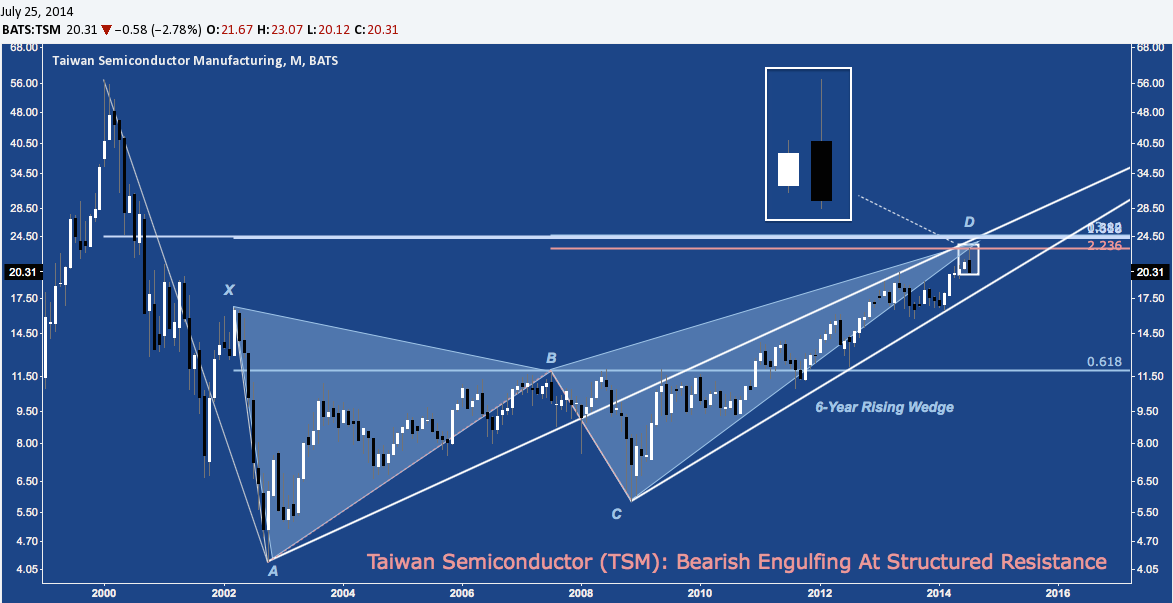
Back on the Monthly, this Evening Doji Star pattern has created a Bearish Engulfing pattern (see inset below) – a tentative bearish candlestick pattern on its own that warrants close attention because it occurs at a major confluence of wedge and cluster resistance:
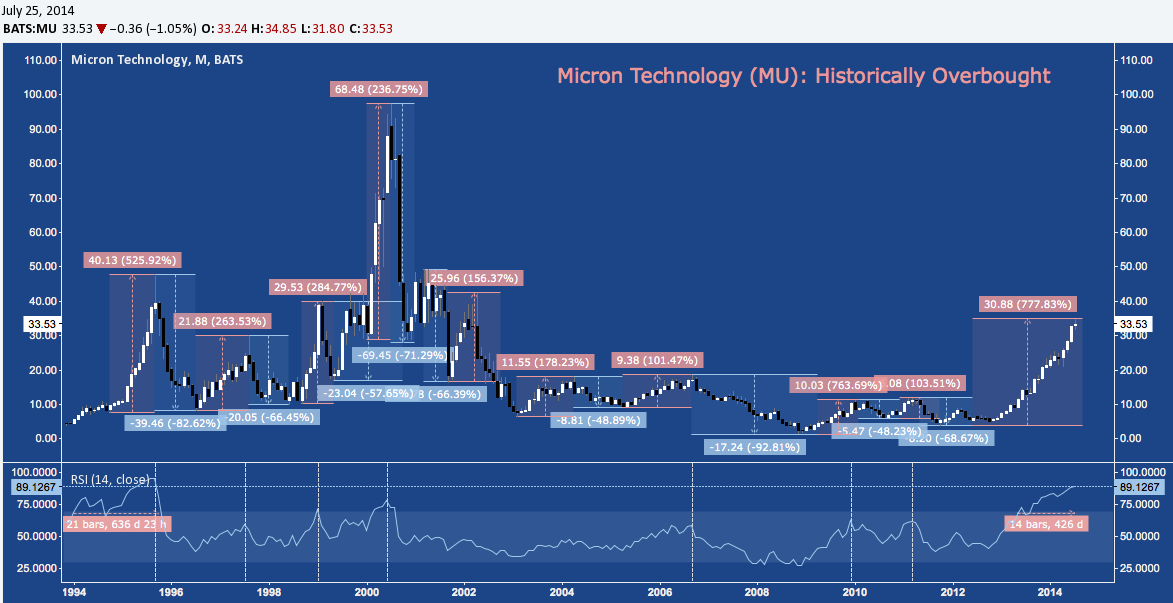
And what about the second largest component in the SOX, Micron Technology (MU)? At 8.5%, Micron has almost a much pull as INTC; and just like Intel and Taiwan Semi it has a penchant for launching into massive spikes, only to give back 50-90%. Second only to 1995 (2013-2014 has already well-surpassed 1999-2000), MU is in it’s most persistently overbought state ever, adding almost 800% since it’s 2012 low.
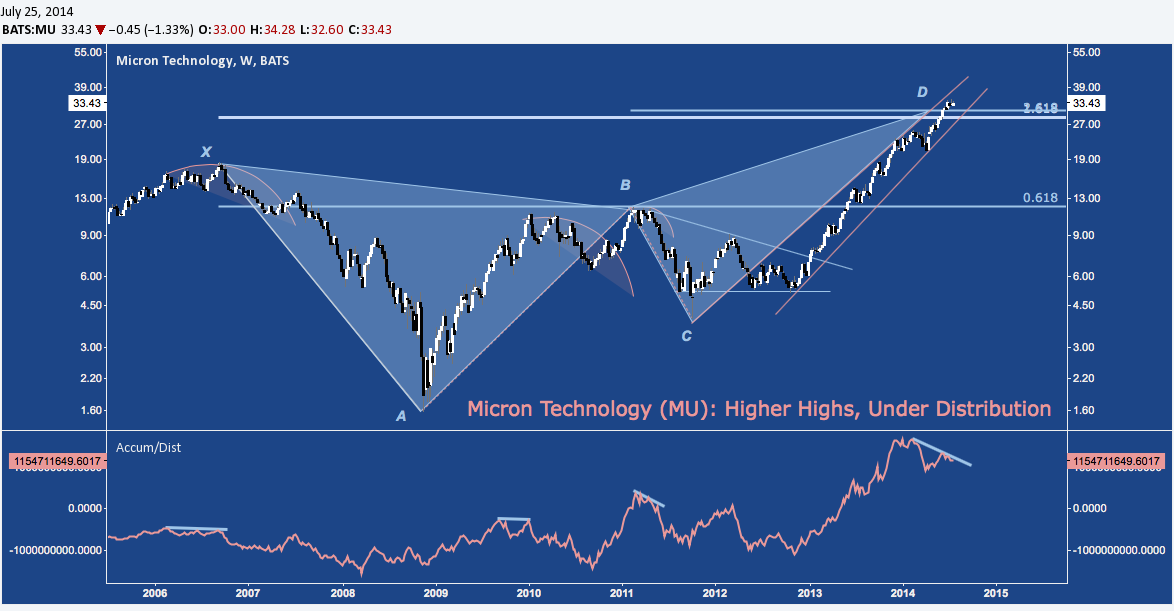
Also like INTC and TSM, MU is at structured resistance (D, below) and important making a (much) higher price high versus late 2013, but on very poor breadth with a huge cumulative A/D divergence (visible in the bottom panel, below).
Whether you’re looking at SMH (INTC and TSM) or the SOX itself INTC and MU), the largest individual holdings by weight are also flashing bright yellow caution lights that complement the major technical hurdle the industry is now facing.
Twitter: @andrewunknown and @seeitmarket
Author holds no exposure to instruments mentioned at the time of publication. Commentary provided is for educational purposes only and in no way constitutes trading or investment advice.


