Investors and options traders sell puts and put spreads to generate additional income or acquire stock. In many cases, traders attempt to time their entry by waiting for oversold extremes. Once the market is oversold, they sell out of the money spreads with the hope that the level they’re selling isn’t reached.
Rather than simply look at price, traders can also look at both implied and realized volatility to filter candidates for selling puts.
In this example, we’ll look at sector ETF’s and endeavor to find sectors with the richest options premiums.
The image below ranks the sector ETFs, including the Russell 2000 ETF ($IWM) and the S&P 500 ETF ($SPY), on three criteria:
- First we looked at Implied Volatility (IV) to Historical Volatility (HV), which gives us an idea of how “rich” options premium is relative to recent movement. And ultimately this leads us to which Sector ETFs have the richest options premiums.
- We also look at the IV to HV percentile. That ranking indexes both Implied Volatility and Historical Volatility over the past year and then takes the ratio. What we know in looking at that number is that a higher ranking means options premium is rich relative to price movement over the past year.
- The last ranking is an average rate of change. The number averages the price performance over the previous 1, 3, and 6 months. Since we’re interested in selling puts, we theoretically don’t want a market that is collapsing and likely to hit the short strike. That being said, some traders might prefer to sell puts in the collapsing market. And understanding which sector ETFs have the richest options premiums helps.
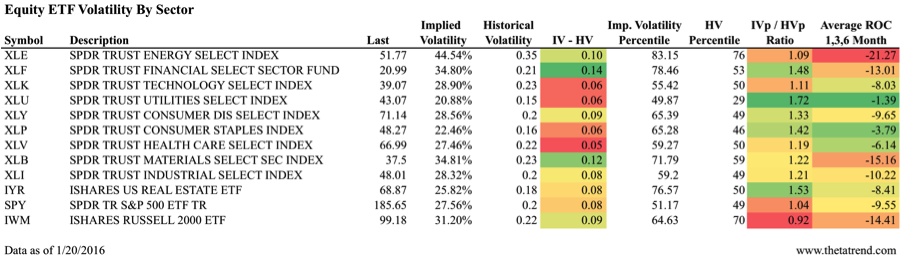
In evaluating the options above, there are a couple of interesting observations.
The Utilities sector ($XLU) and Consumer Staples ($XLP) are both trading with some of the richest options premiums relative to the past year even though their raw number for IV – HV is low relative to the other sectors. Additionally, both of those sectors have held up well based on the average rate of change.
For traders who are more comfortable with price risk, the Financial ($XLF) sector is trading with both a high raw premium of IV to HV and a high premium in annual terms. The Financial sector has been weaker in price terms and implied volatility seems to be reflecting that risk.
The important thing to remember is that price is only one part of the picture and we can find unexpected clues about the market when we evaluate volatility. Thanks for reading.
Twitter: @ThetaTrend
Author holds positions in S&P 500 and Russell 2000 related securities at the time of publication. Any opinions expressed herein are solely those of the author, and do not in any way represent the views or opinions of any other person or entity.


