The Bears have sunk their teeth into shares of Apple (AAPL) with the stock recently trading down as much as -17.57% from its April high of $112.10. Considering that AAPL is now near its 52 week lows, investors are starting to look for an Apple stock bottom.
Let’s dig into the technical setup on the AAPL chart.
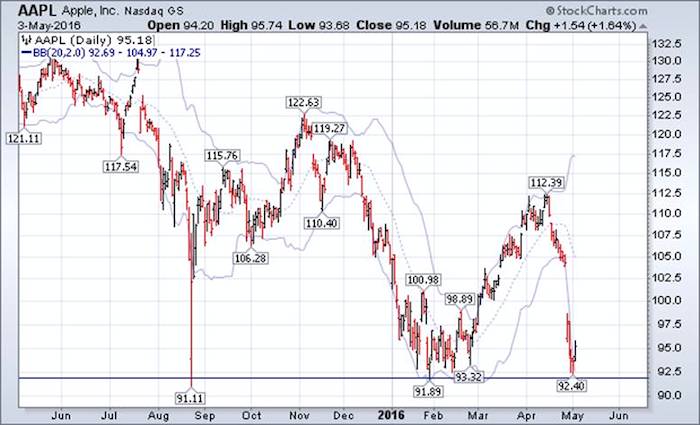
In the short-term, the stock has traded decisively below its lower Bollinger Band, retested its February low, and left one massive gap between roughly $98.71 and $104.35. Support is and was there as opportunistic dip buyers have already been rewarded with AAPL trading up 3% from yesterday’s low at $92.40.
So, we should have an Apple stock bottom in place, right? Not so fast…
Over the intermediate and longer-term there’s evidence to suggest AAPL may have additional downside over the months ahead. When I analyze a monthly chart of AAPL, I observe that every single bottom over the last two decades has occurred with the stock’s monthly Relative Strength Index (RSI) equaling a value of 40. As of right now, AAPL’s monthly RSI sits at 46.13, which means we’re close, but not there just yet.
Additionally, every major Apple stock bottom has occurred with the price of AAPL closing a calendar month at and around its 50% or 61.8% Fibonacci retracement from its prior trough to peak values. Identifying Fibonacci Retracement levels from AAPL’s monthly closing low in 2013 of $53.58 to its 2015 monthly closing high at $128.44 places the 50% retracement at $90.96 and the 61.8% retracement at $82.11. Again we’re close, but not there just yet. So investors will have to exercise patience in attempting to identify an Apple stock bottom.
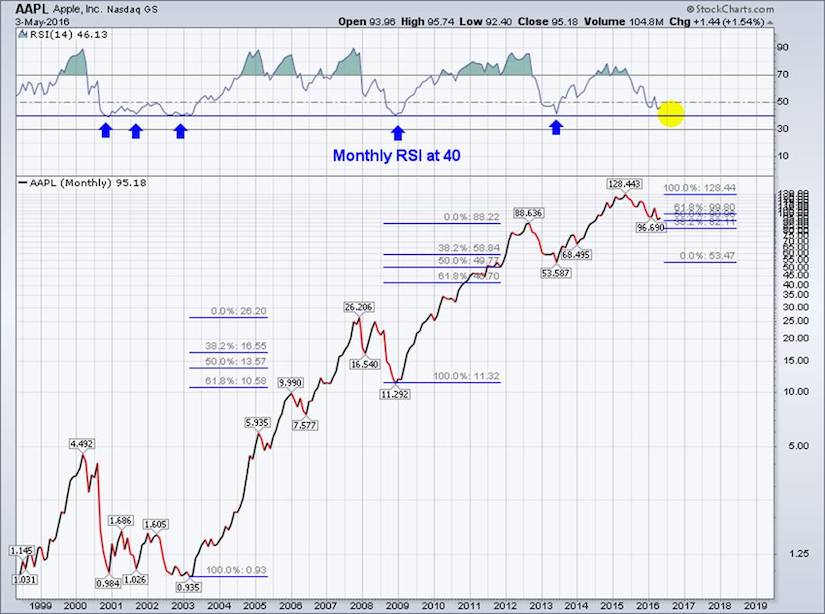
Unless this time is different, Apple stock (AAPL) likely has additional downside on a monthly closing basis in its near future. If history is any guide, the stock should close a calendar month between $82.11 and $90.96 with its monthly Relative Strength Index (RSI) equaling a value of 40. And, in my opinion, it’s always dangerous expecting this time to be different.
Thanks for reading.
More From Steve: Bollinger Bands Squeeze: Massive Move Coming For Stocks
Twitter: @SJD10304
The author does not have a position in mentioned securities at the time of publication. Any opinions expressed herein are solely those of the author, and do not in any way represent the views or opinions of any other person or entity.

")

")


