 The Russell 2000 (RUT) has been consolidating for the past several weeks in a wide range. And since the other major US equity indices have been headed higher, you could also say that it has been underperforming. Needless to say, this has several investors concerned, as the Russell 2000 is made up of small cap stocks and often is indicative of investors risk tolerance.
Currently the Russell 2000 is sitting on an important Fibonacci support level, yet is still well within the longer-term uptrend channel.
A lot has been made of the Russell 2000 death cross, but the index isn’t dead quite yet. However, it is worthy to note that the RUT needs to see some buying here (or just below) to maintain the current Fibonacci levels.
Below is a 17 year, weekly view of the big picture for the Russell 2000.
Russell 2000 Weekly Chart
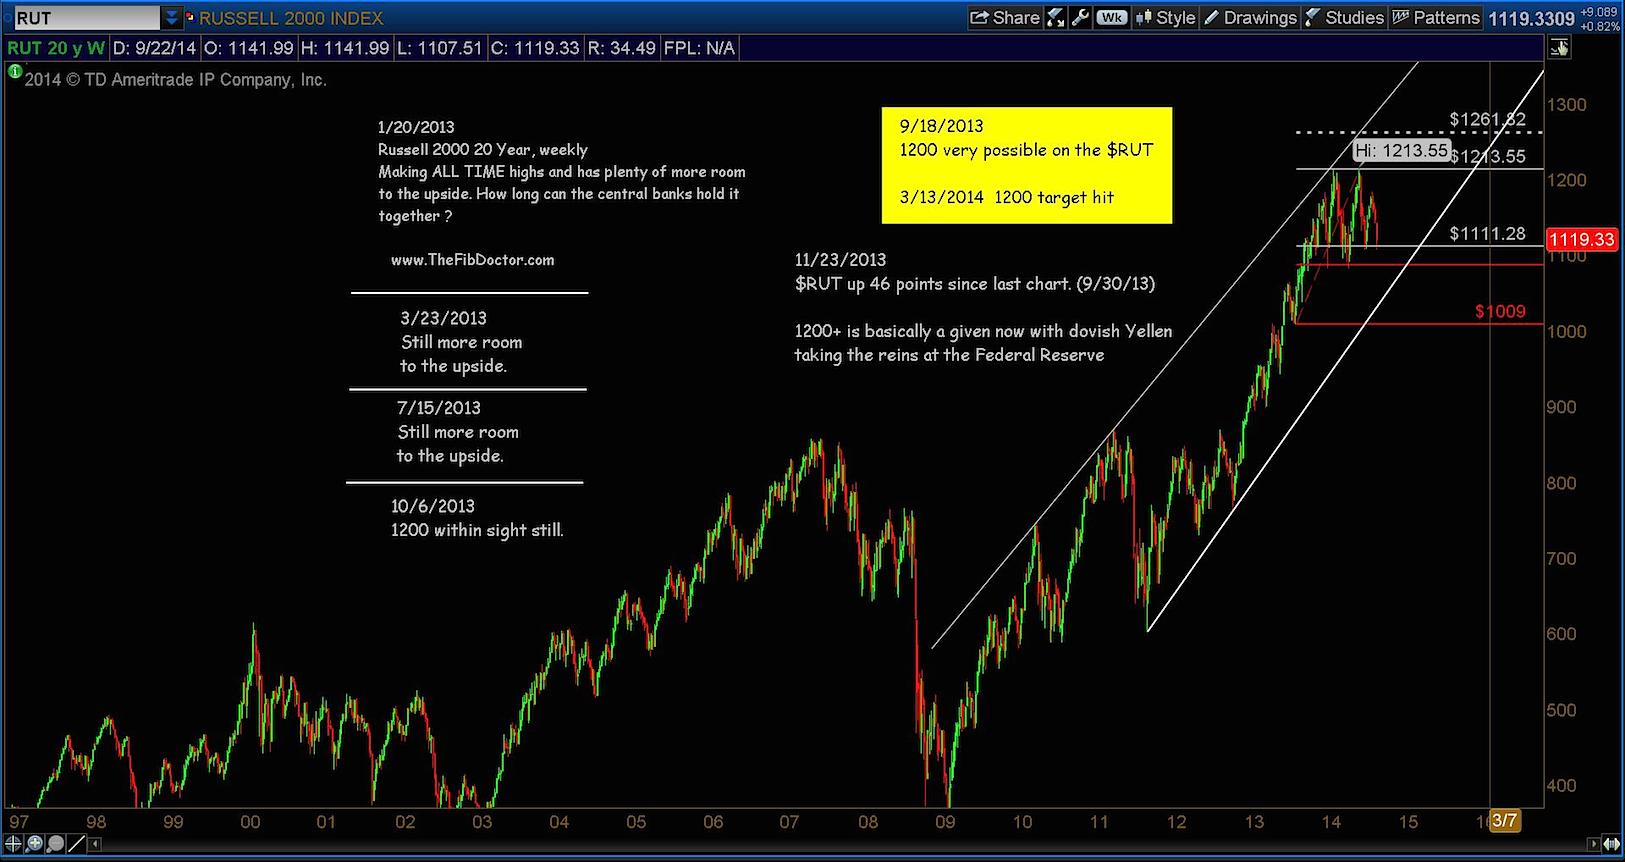
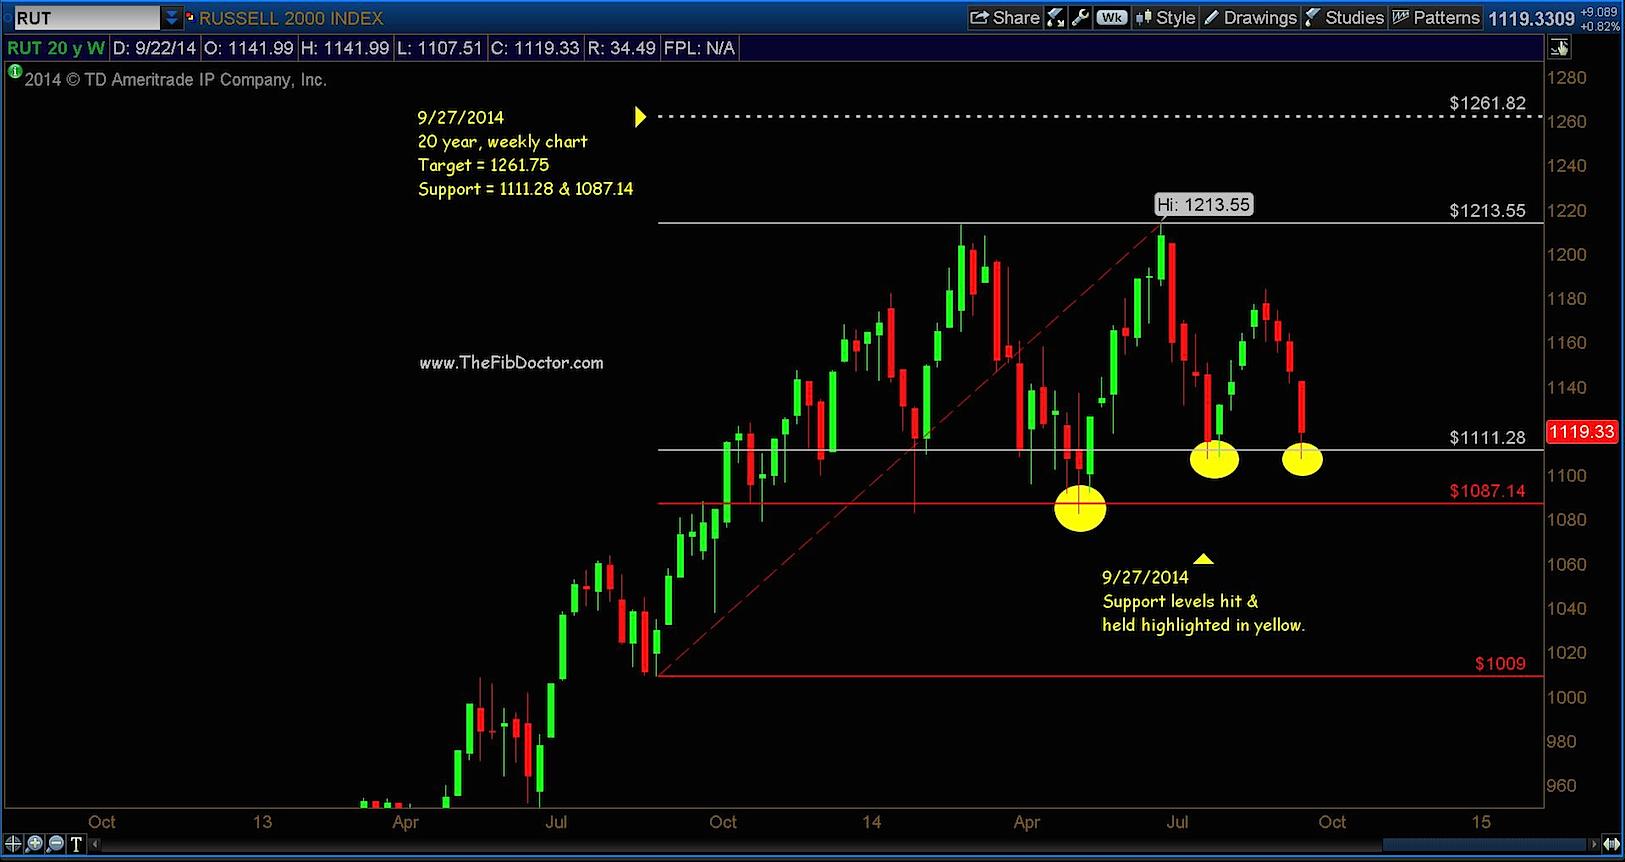
Now let’s take a closer look at some hard support numbers. Keep in mind that these are weekly candles.
- 1st support = 1111.28
- 2nd support = 1087.14
- Target = 1261.75
You can see in the chart below that the 1st and 2nd supports have been tested and held to this point. This is important. A weekly close below 1087 would technically weaken the Russell 2000. That’s the number to watch for now.
Russell 2000 Weekly Chart – Zoomed In 2013/2014
No position in any of the mentioned securities at the time of publication. Any opinions expressed herein are solely those of the author, and do not in any way represent the views or opinions of any other person or entity.

 Rolling Over At Key Fibonacci Level?")


