 By Andrew Kassen Following the Dow Jones Industrial Average, the S&P 500 and NASDAQ Composite, small cap benchmark Russell 2000 (Index symbol: RUT; Futures: TF; ETF: IWM) is confirming yet another move higher with a break above the 951.3 all-time high it set on March 25th. Now strong technical indications suggest this may be the start of a move through 1000.
Last time we looked in on the Russell (R2k) (check out that 04/25/13 post here) we noted the index was pushing higher, but not quite free-and-clear of some impediments that – once cleared – would it room to run yet again.
In light of this morning’s post-NFP price action, those obstacles are gone, with Russell 2000 Futures at a fresh all-time high around 955 on last check. A few developments in the last week put a decisively more positive spin on the index and now provide the technical undergirding for this morning’s breakout.
Russell 2000 (Symbol: TF) – 4 Hour : (click image to zoom)
Let’s look at the major changes noted on the above chart in more detail:
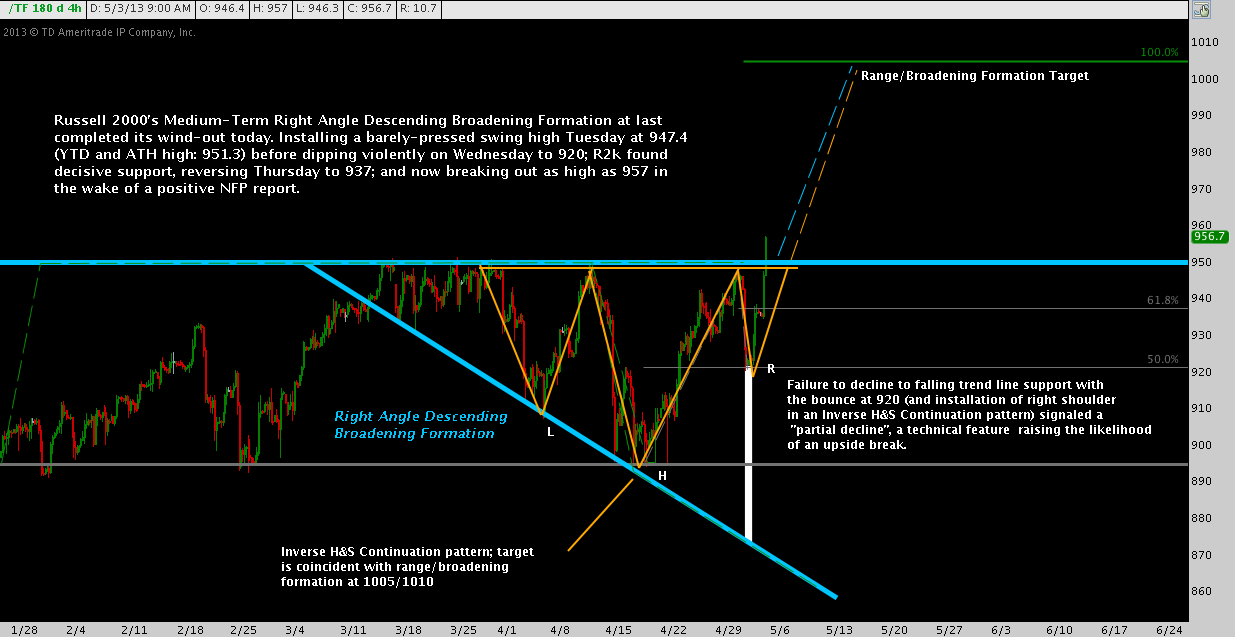
As a refresher: even though the index is up significantly year-to-date, R2k was bounded through this morning by a broad range between 895-950 for most of 2013, made apparent since the slide from 951.3 to 895 began in mid-March. The action since that point created a Right Angle Descending Broadening Formation (RADBF), visible here in blue.
A RADBF, taken by itself, provides no statistical edge in favor of an up or downside break. Despite the ambiguity this pattern’s history of near-random outcomes creates, though, there are other means to assess it. Specifically, rather than concentrate solely on past outcomes, we can turn our attention to what happened on inside the present pattern.
For some context, here’s an overview of the major developments in the last week:
- On Tuesday, R2k set another swing high at 947.4, appearing weak by lingering there only briefly and without any attempt to really touch or break the 951.3 high. Though it was a lower high, this effectively counted as another, approximate touch at RADBF horizontal resistance.
- Late Tuesday and Wednesday brought another of the now characteristic drops from this level: this time back to 920 and seemingly on the way to another 895 test. However, R2k paused near the 50% retracement of 895-951 at 920.
- Thursday brought a bounce from 920, buoyed by the lowest initial unemployment claims 4-week average in 5 years and further ECB policy accommodation to close near 937.
- Then this morning, the almost uniformly positive NFP print surprised to the upside, pushing Russell 2000 futures (TF) still further up. R2k finally broke 2013’s 895-950 congestion with a strong momentum break after the cash market open at 0930ET.
What signaled this might occur? Most notably, the partial decline that was put in when the index only declined to 920 on Wednesday’s drop. Though Tuesday’s high was tentative and weak, the bears’ inability to push R2k to RADBF falling trend line support (now around 870) – or even a return to the much dispute 895 horizontal support – indicated selling pressure was considerably weaker than it had been just a week before. That partial decline is denoted by the thin white rectangle above.
A partial decline is one thing, and is usually only apparent in retrospect. But in this case, the abortive move down created the right shoulder in an Inverse Head & Shoulders continuation pattern (in yellow), also suggestive of a break higher.
From here, there are various means to extrapolate targets higher; but Russell 2000 – like the S&P and the Dow – are in uncharted territory. Outside acting consistent with principles of trend following and monitoring momentum, applicable tools in the technician’s toolbox are admittedly fewer.
But there are some that are still applicable: among them the classic patterns we’ve been following. The 895-950 range and RADBF and Inverse H&S continuation pattern all point toward a target of 1005-1010, just above the round number of all round numbers: 1000. Frustrating all the well-put arguments against a well-extended bull market; and in spite of historic “Sell in May and Go Away” seasonality, these patterns call for +6% from here: pushing R2k into the next millennium of price.
Twitter: @andrewunknown and @seeitmarket
Author holds a position long Russell 2000 Mini Index futures (Symbol: TF) at the time of publication.
Any opinions expressed herein are solely those of the author, and do not in any way represent the views or opinions of any other person or entity.


")


