After a blistering +37% run in 2013, Small Cap benchmark index Russell 2000 has spent the balance of this year oscillating a broad sideways consolidation bounded by 1210 above and 1080 below. This range was set by the 02/05-03/03’s parabolic drive higher and has now prevailed over the last 6.5 months.Depending on timeframe, the Russell’s (in)action in 2014 has provided market players and observers with wildly disparate experiences.
As a trader who runs separate programs on short and medium-term timeframes (corresponding to the second and third items, below) and can be bullish or bearish (or often, both), these are my own impressions:
- The Long-Term Investor: “The Russell 2000 has done nada since Thanksgiving 2013; and it’s YTD return is about -3%. This thing has out-performed it’s peers for so long I wouldn’t want to bet against it relative to the likes of the S&P 500; but as a persistent laggard for almost a year now I wonder if that’s changing amidst mounting evidence (see Chris Kimble and Jesse Felder’s excellent recent pieces here and here for more on this theme). Words that come to mind: boring, lackluster, better-ROI-in-T-Bills, negative beta, market cap relative weakness.
- The Swing/Position Trader: “It’s been an amazing year so far. From 2013’s closing print at 1163.64, R2k has ranged +4.2% higher and 7% lower, with quiet consolidations that have created ideal conditions for breakout/momentum setups, and abrupt bouts of volatility that provided nominal double-digit moves in just a few weeks. I’d describe this year as a trader’s market, technically intuitive, a great lesson in reacting to rather than anticipating breakouts, and period in which poor execution has been bailed out in virtue of range trade.
- The Day Trader: “The Russell has been just as volatile as last year, but less predictable and singleminded. Like 2013, the trends are irrepressible once they get underway; but instead of streaking higher ad infinitum it’s been much a more opportunistic and dynamic environment. R2k in 2014 has been technically straightforward, trades like an entirely different asset class compare to Large Caps.”
Past is prologue, though; and it now looks like the Russell 2000 is poised to shift from neutral back into a trending environment in a way relevant to each of these practitioner categories as multiple technical barriers big-and-small that have hemmed the index in are set to break.
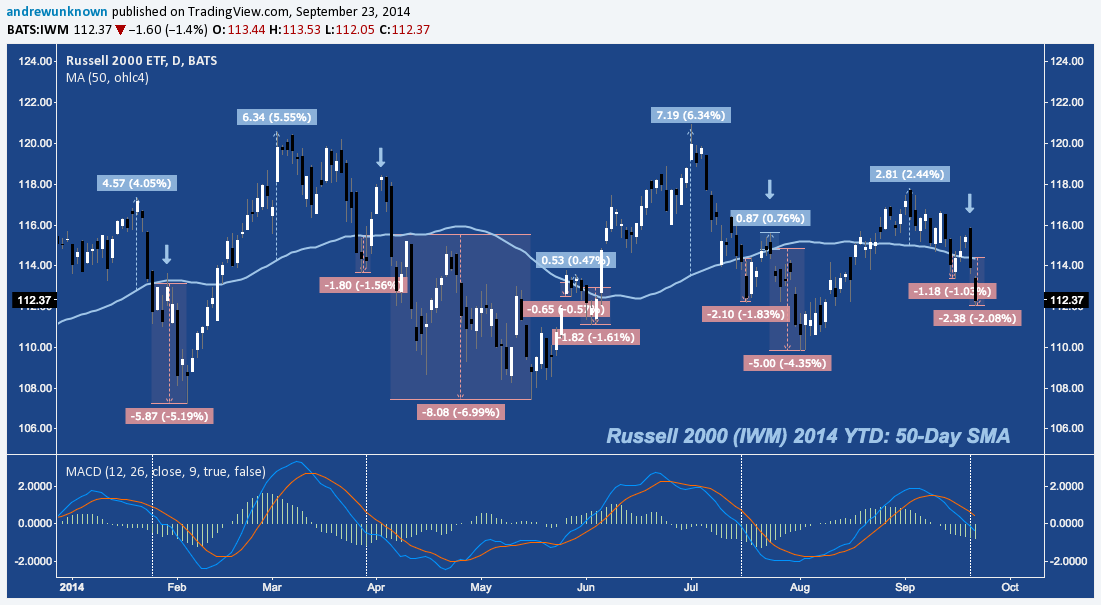
1 – Russell 2000 and The 50-Day SMA
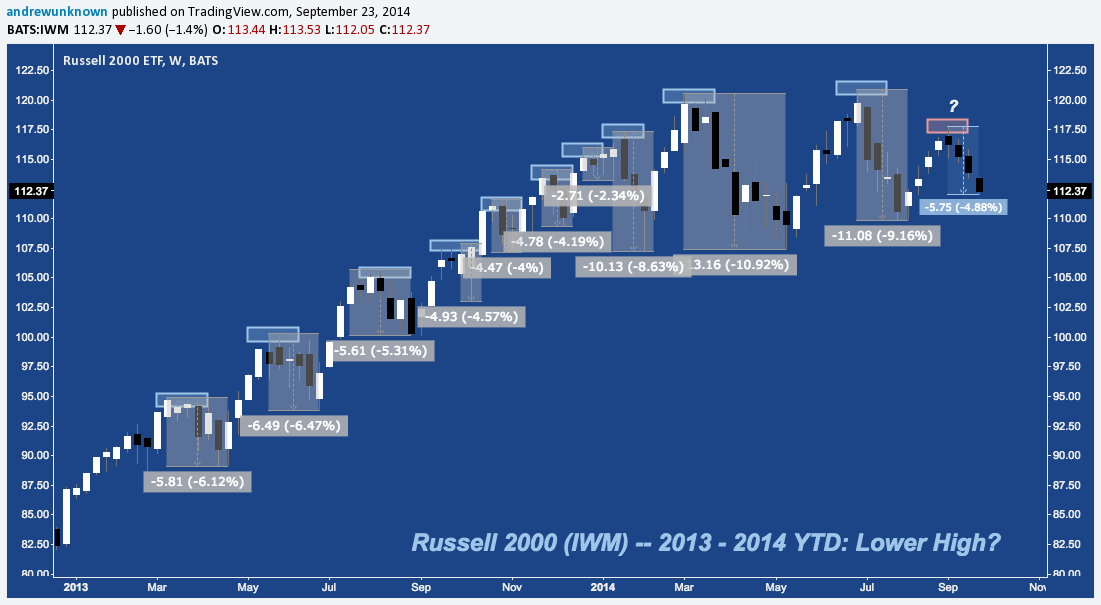
The Russell 2000 iShares ETF (IWM) closed anew beneath it’s 50-Day Simple Moving Average (SMA) for the eighth time last Friday this year, a stat as representative of any of the Russell’s rangebound condition.
This sequence of breaks has followed a now familiar pattern of 1) Major local high (denoted by blue labels showing distance above the 50SMA), 2) sharp selloff culminating in a 50SMA break, 3) throwback higher to or just above the 50-Day SMA (marked with blue down arrows), 4) a fresh 50SMA break with 5) continuation to a lower low v. #2 where a more durable bottom is installed. Notice the second 50SMA has closely followed a negative MACD crossover and coincides with the MA crossing under 0.
IWM’s rally above the 50SMA this last time around was unimpressive, but aside from that it is following the 2014 YTD script well. Last Monday, 09/15 IWM’s initial break below the 50SMA, followed thereafter by a mid-week throwback that bracketed the FOMC on Wednesday before it all back in a large bearish engulfing candle on Friday that slashed back through the 50-Day, seemingly on its way to the lower low in #5 above. As a basis of comparison to the current pullback, the three previous occurrences of this sequence in so far in the year have averaged a lower low -5.51% beneath the 50-Day SMA. Monday, 09/22/14’s low at 112.05 was -2.08% beneath.
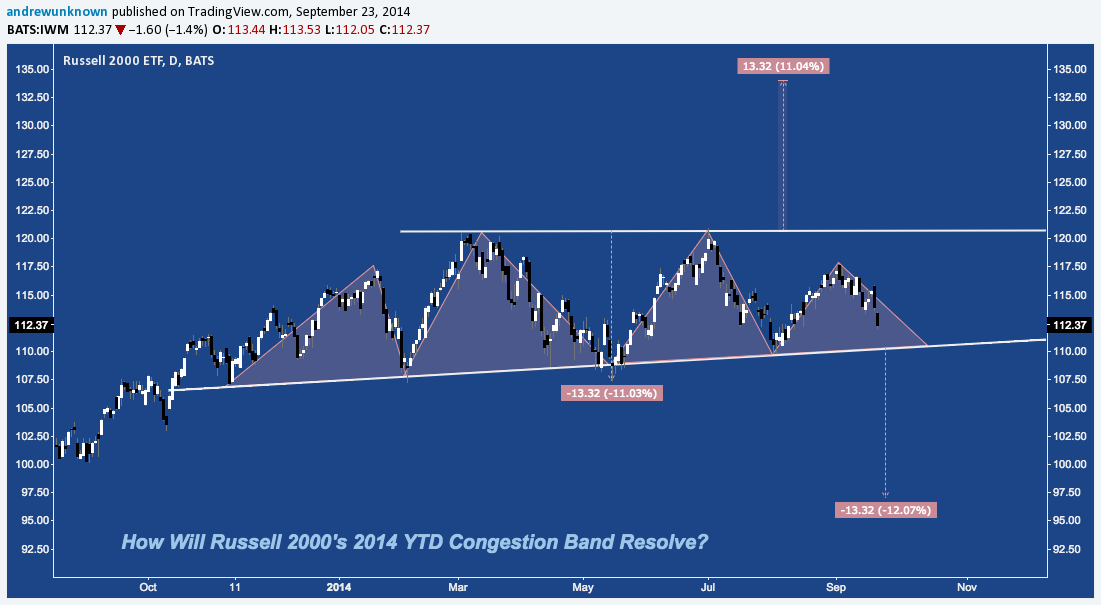
2 – Russell 2000 and The Consolidation Band
Scale back the noise of IWM’s entanglement with it’s 50-Day SMA and you can see this tortuous action has built out a simple consolidation band measuring nearly 11%. A more elaborate interpretation of this range is a potential Complex Head & Shoulders Top pattern, which I discussed over here a few weeks ago. The lower trend line is diagonal with each touch serving as a potential support rung, complicating any downside breakout. Overall, though, this consolidation band is building toward a trend continuation or reversal with measured move implications of 11% higher and 12% lower.
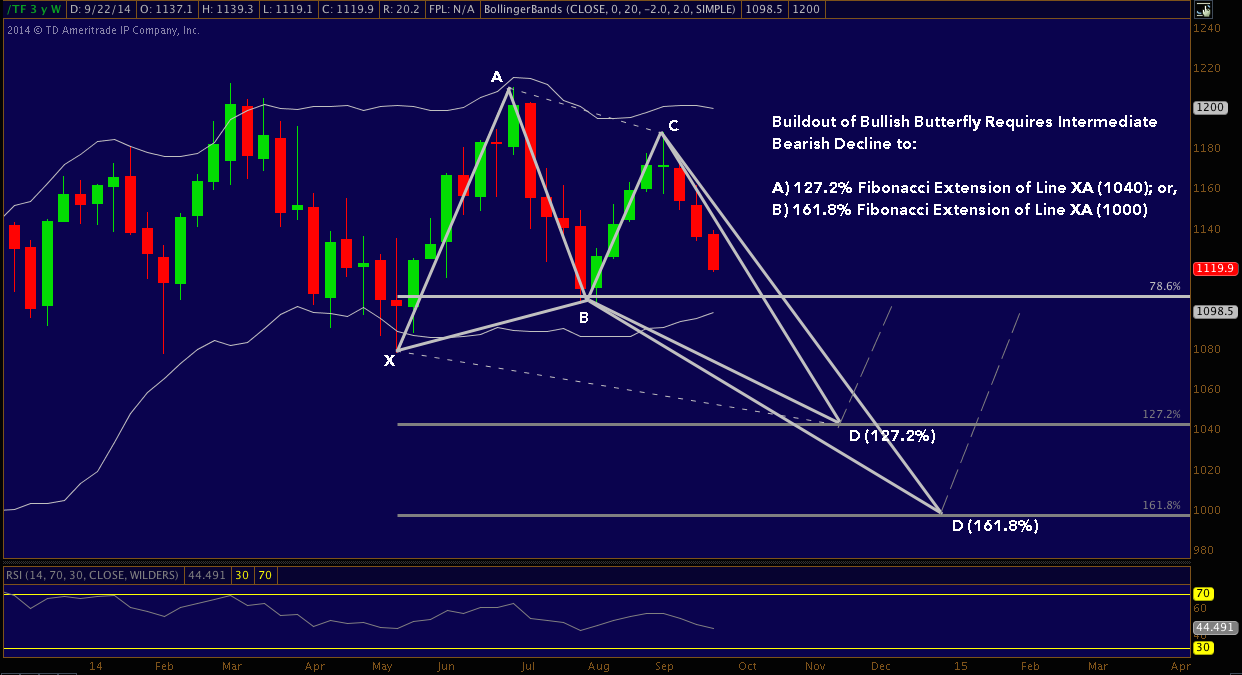
3 – Russell 2000 and the Lepidoptery
Turning to the Russell 2000 Mini Futures Contract (TF), we note the last two troughs and peaks (beginning in May) have constructed all but the final reversal point of a Bullish Butterfly harmonic pattern. This doesn’t argue for an upside resolution from the consolidation band, however. A buildout to point D to complete the pattern entails a drop to the 127.2% extension of XA at 1040, and potentially to the 161.8% extension of XA near 1000.
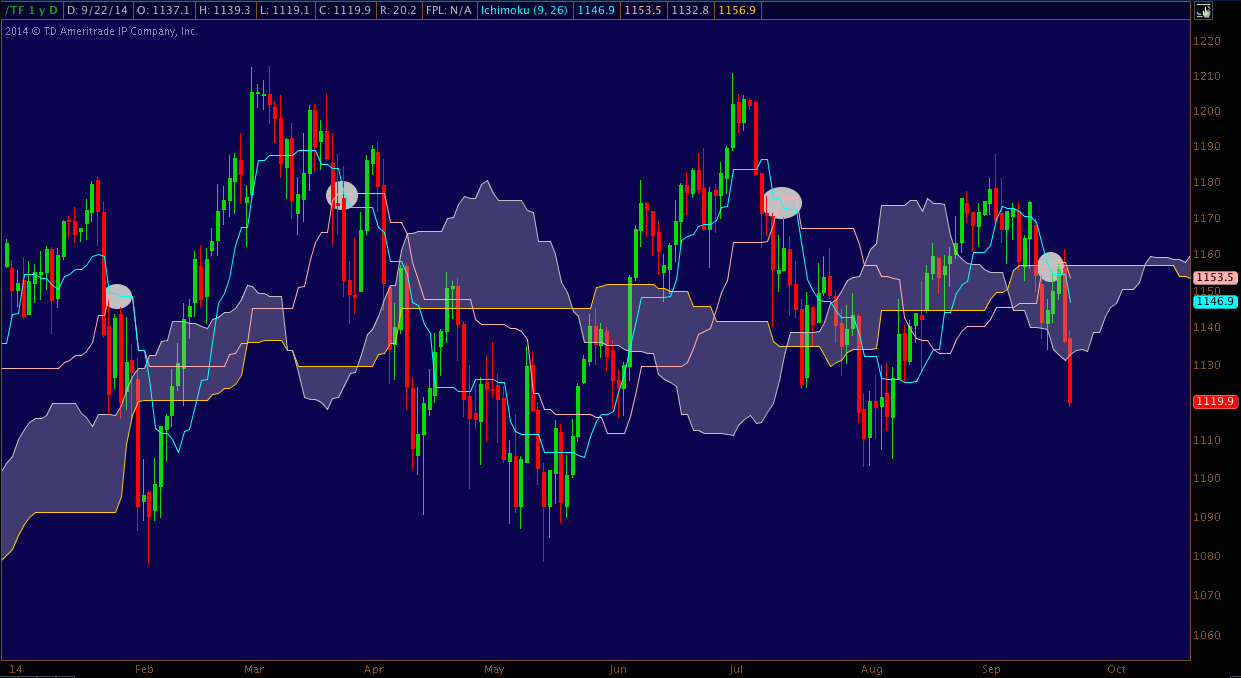
4 – Russell 2000 and Old Japanese Man Drinking a Beer
Though intimidating at first glance, there are few technical representations that give a clearer picture of a trading instrument’s (dis)equilibrium than Ichimoku Kinko Hyo (click the link to learn more about it; and the
old Japanese man drinking a beer). Yesterday TF broke beneath the Ichimoku cloud after rallying to and getting rejected at the top of it. In addition to this, Tenkan-Sen (blue line) crossed below Kijun-Sen (pink line) inside the cloud in Ichimoku’s version of a bearish MA crossover to raise the TF from a weak to moderately bearish signal.
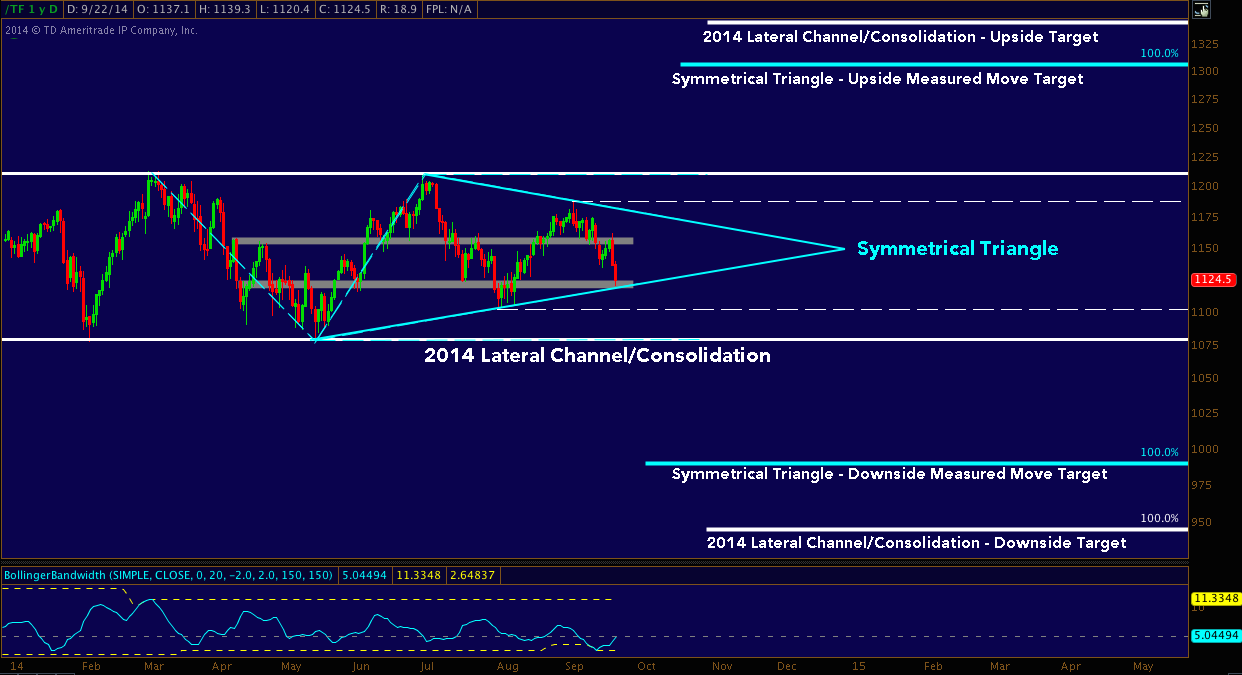
5 – Russell 2000 and Getting to the Point
The troughs and peaks mentioned above that make up the potential Bullish Butterfly Pattern can be alternately viewed as a multi-month Symmetrical Triangle. The breakout from this pattern will send TF back to 1180 or 1100 at least, beyond which lies the consolidation band boundaries at 1210 and 1080. Full measured move targets for this triangle look for 1300-1310 above and 990-1000 below, as indicated in blue. Volatility as measured by Bollinger Bandwidth (see lower panel) is picking up versus early September’s deep trough but is still very low compared to longer-term norms, suggestive of coming range expansion and the breakout that will accompany it.
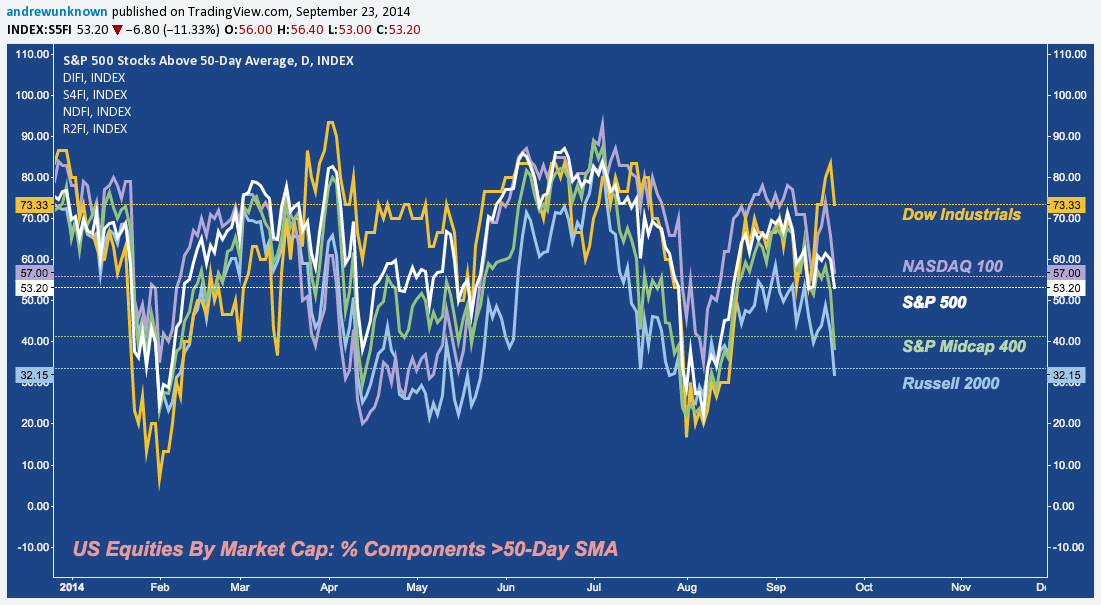
6 – Russell 2000 And The Pull-ups It Just Can’t Do In Gym Class
Examining US indices through the lens of rally (or pullback) participation, we note the Russell is the laggard among it’s fellow benchmarks across all timeframes. Below is a snapshot of the percentage of index components trading above their 50-Day SMAs in IWM, the S&P 500 (SPY), S&P Midcap 400 (MDY), NASDAQ 100 (QQQ) and Dow Jones Industrial Average (DIA). The level of diffusion across indices is now the greatest it has been in a year of particularly disparate relative strength across market caps. In periods where this disparity becomes most acute – early January, April and early-mid July – equities are typically in the early-to-mid stages of the pullbacks this metric tracks. With the exception of January, in each of these cases the Russell has been the weakest of its peers, seemingly unable to lift itself up off the floor sustainably.
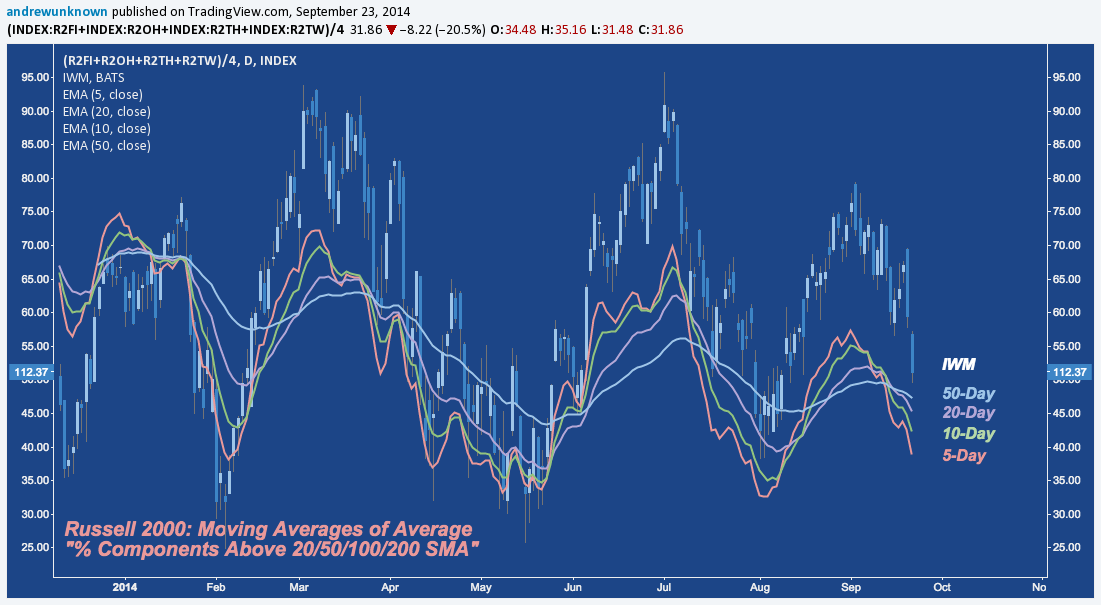
7 – Russell 2000 and The Breadth Atrophy
Moving to a more inclusive view of index breadth and participation, bellow you can see IWM again (blue candlesticks), overlaid this time with an average of the % of components above their 20, 50, 100 and 200-Day SMAs, smoothed with 5, 10, 20 and 50 Day-EMAs. The net result is a composite view of participation across multiple loopback periods. The Russell looks very beaten down; but this is against the limited context of 2014’s consolidation band. A steady, long-running trending market higher can bury the needle on composite metrics such as this; and conversely for longer, protracted declines. As a result the Russell’s deteriorating breadth may soon halt near this level; but should a downside breakout or fulfillment of any of the above patterns occur, it may not revert higher for days or weeks to come.
The refrain offered up by each of the charts just reviewed is that Russell 2000 has been weakest among it’s peers throughout most of 2014 and may be losing grip on its exalted position as long-term relative strength leader among market caps but looks like it may bounce nearby to further delay resolution of it’s 8.5 month consolidation. Nonetheless, the successively lower peaks in participation above empirically demonstrates a trend of stealth distribution that is a gnawing, worrisome sign suggesting the rug could be pulled from under R2k shortly after installing all-time highs.
As the index again slides toward the lower bound of it’s 11% range is it offering any clues about how it will finally resolve? Whatever the timeframe corresponding to your process, if you invest or trade any US small cap product, the context offered by the below charts will prove crucial in the days and weeks to come.
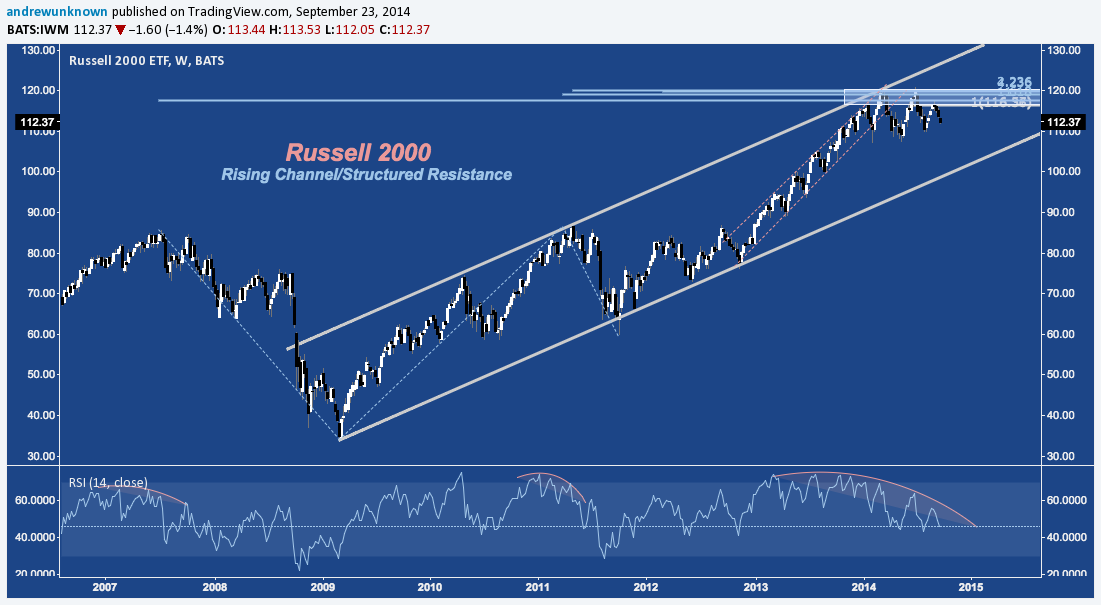
8 – Russell 2000 and The Sacred Math Overhead
As a result of 2014’s range, R2k has slouched sideways after tagging cyclical trend line resistance in early March out into it’s 5.5-year Rising Channel (in gray, below) and breaking from November 2012-December 2013’s impossibly uniform mini-channel up. Time and Price came together in March with the confluence of channel resistance and structured fibonacci resistance near 120, including the 161.8% extension of the Russell’s mid-2007-early 2009 range. Underneath the weight of this technical intersection, deterioration of the cyclical momentum that began in mid-2013 has escalated despite higher highs through early July in a setup highly evocative of 2007’s topping process.
9 – Russell 2000 and The Rudiments of Keeping Your Spot In Line
Nonetheless, the rising primary trend in small caps is intact. Or is it? Following Charles Dow’s rudiments of trend identification, has the Russell’s trend passed through accumulation, participation and now excess? Analysts such as Dana Lyons, Jesse Felder and See It Market’s Ryan Detrick have noted for months that hard allocation metrics (rather than squishy data such as Conference Board, University of Michigan, Gallup, II, AAII, NAAIM and a bloated repertoire of PMI sentiment surveys) such as NYSE Margin Debt and the Fed’s Z.1 release have signaled heavy participation and potential caution on the build-out of leverage and household asset allocation to equities to rarefied or record highs. The chart below shows how cleanly bifurcated the Russell’s behavior is over the last couple of years. Does the IWM’s transition from a 45% gain over 14 months to a flat-to-negative market over the most recent six culminating in it’s first major lower high since early 2012 indicate a longer-term trend change is underway?
10 – Russell 2000 and the Yawning Gap
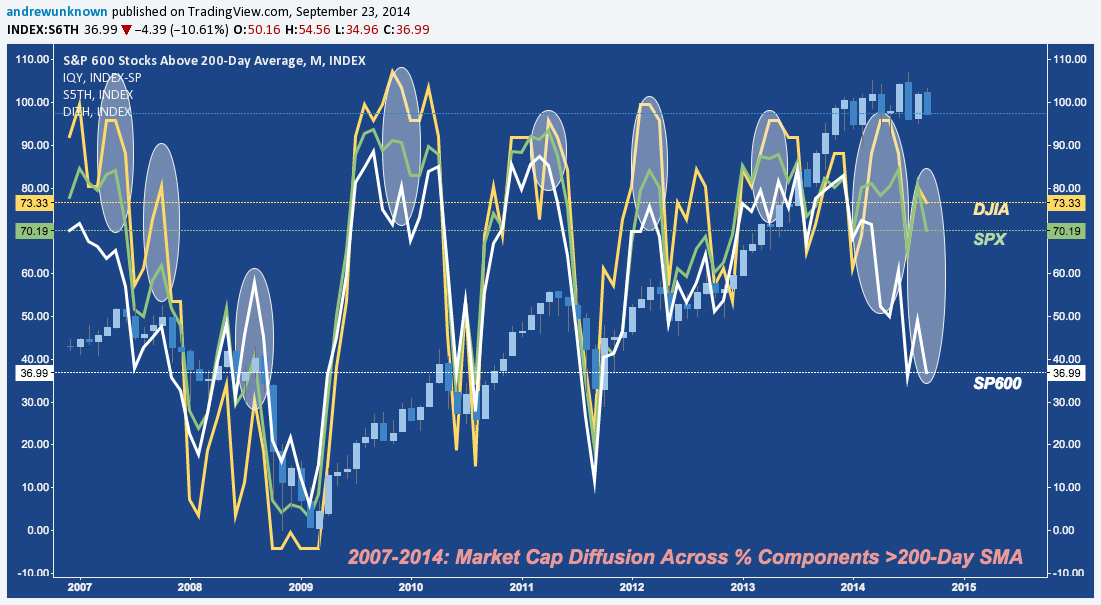
Taking a longer view of participation, the segment of small caps (derived here from the S&P Small Cap 600) trading above their 200-Day SMAs has cratered to less than 4 of every 10. Compare this to components holding above their benchmark long-term moving average in the Dow Industrials (73%) and S&P 500 (70%). Divergences in market cap participation are common as relative strength themes wax and wane and flows rotate through the business cycle’s risk profile. But, the level of compression or diffusion between market cap readings is often indicative of major turns up and down; and at present this metric shows more of a larger divergence between small and large caps than at any time since late 2007.
11 – Russell 2000 and The Geometry Theorem
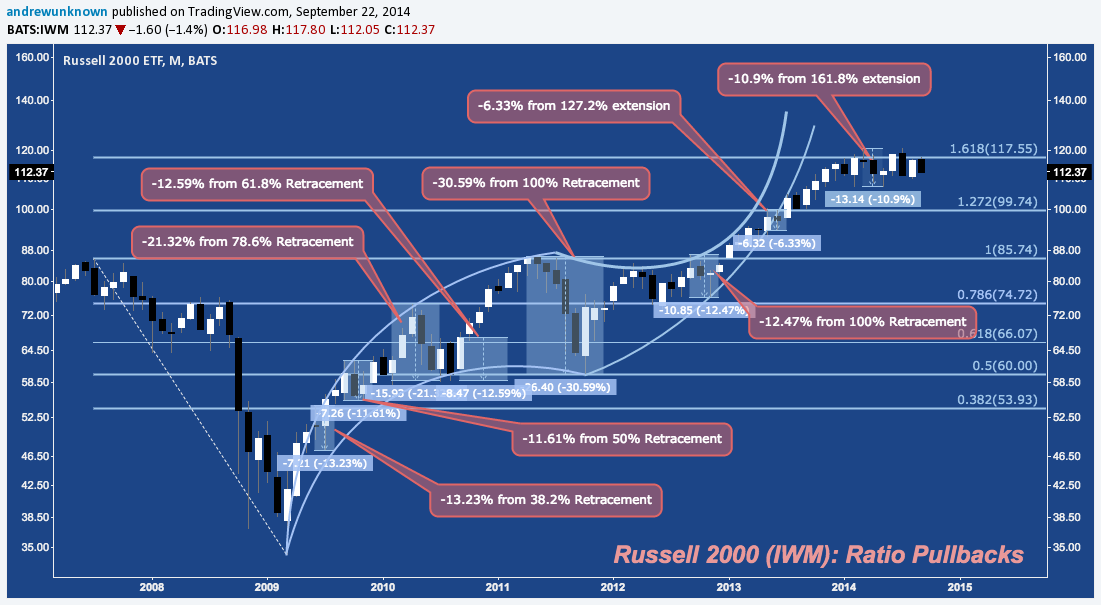
“Late 2007” seems evocative of ominous tidings; but the alternative scenarios of 2014’s consolidation are not “resumption of uptrend” or “crash”. Consider the context of the last 5.5 years, in which the Russell 2000 has pulled back at every fibonacci retracement and extension level given off by the 2007-2009 decline. Among these geometric ratio pullbacks, 2014’s peak-to-trough -10.9% decline ranks just 7th of 8 (with the shallowest May-June 2013’s -6.33% dip) and remains far short of the -15.44% average over the seven previous occurrences. A decline of merely average depth derived from this 2009-2013 average would return the Russell to 101-102, within spitting distance of it’s previous extension level.
12 – Russell 2000 and Crustaceans (Terrible Band Name)
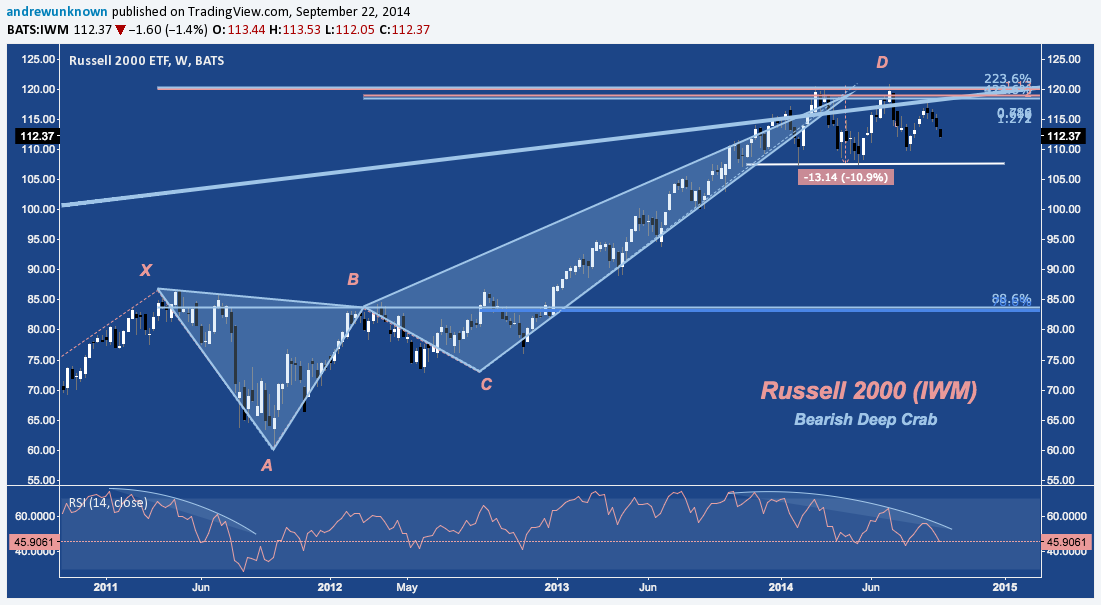
But there are other reasons both credible and compelling that suggest this decline may turn out differently. Among them is the 3.5-year Bearish Deep Crab that has been scuttling toward it’s PRZ since R2k’s secondary bottom in early 2012 (at C). This Crab has several measured move targets, with the major objective near B around 84-85. This would amount to no less than a full retest of late 2012’s breakout 2007 and 2011’s highs near 86 – a nearly 30% drop from IWM’s ATH at 120.97.
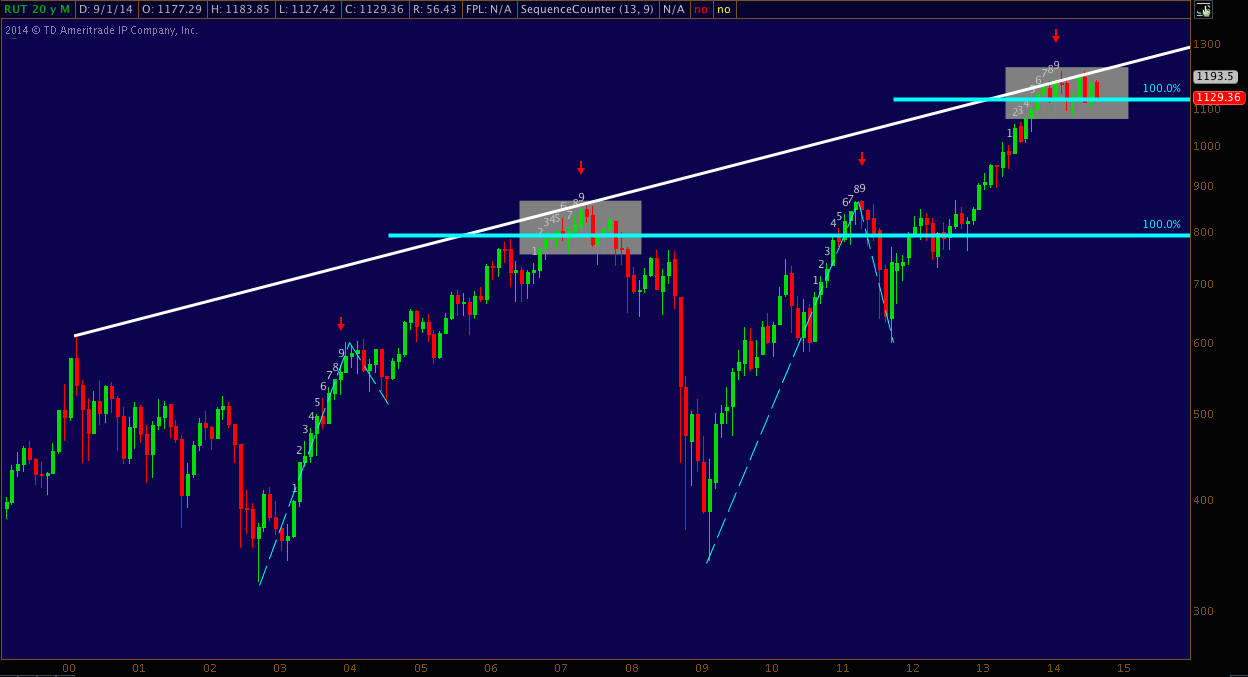
13 – Russell 2000 and the Perfect Sell
Speaking of compelling, the final two charts here are genuinely fascinating and demand sober attention. The first is the monthly chart of the Russell 2000 (RUT), which is currently:
- Up against secular trend line (log) resistance,
- At it’s 100% ABCD extension target off the 2009 low (A) and 2011 high (B) and low (C).
- Flat against TDSequential’s February 2014 Perfected Sell Formation (Demark).
R2k has seen just three TD Perfect Sells on it’s monthly chart over the preceding 15 years, defined as a sequence of nine months where each feature a close greater than 4 candles prior that is then perfected by a close higher than months 6 and 7 close. As it turns out, 2002-2007 and 2009-2014 follow the same pattern:
- A cyclical bear market low, preceding
- A motive leg higher; triggering
- A TD Perfected Sell Signal (red arrow), denoting a bearish price flip into
- A major bull market correction that flips bullish into a second leg higher, matching the first in length to make
- A completed ABCD (blue line) and
- A new TD Perfected Sell
Will RUT complete the 2002-2007 sequence with a bear market, this time from established trend line resistance?
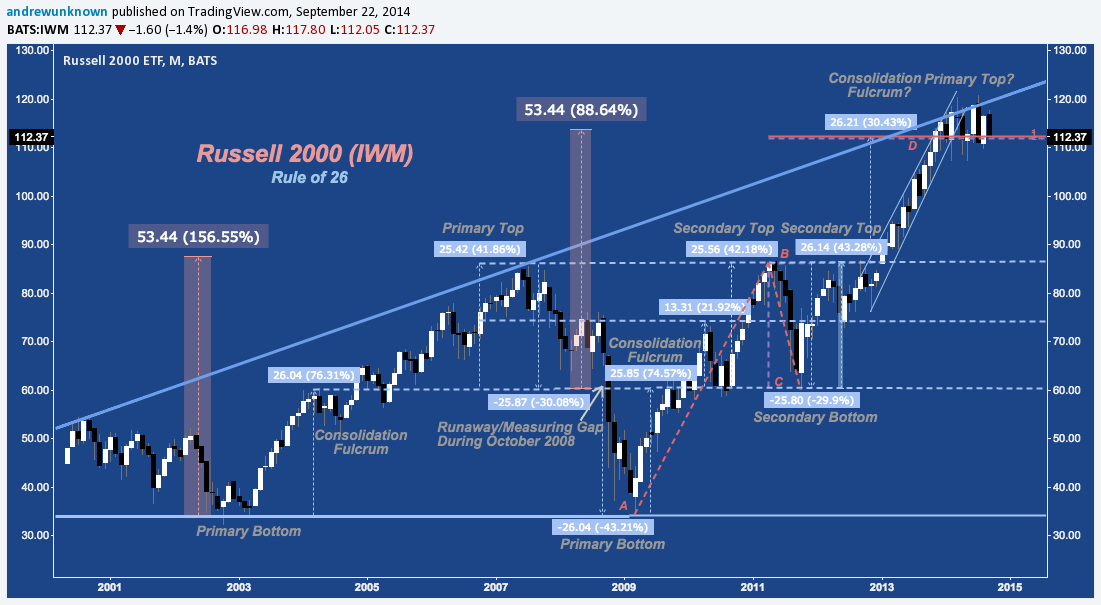
14 – Russell 2000 and The Rule of 26
If IWM’s Rule of 26 is indicative, the answer is “probably, yes”. Since it’s 2002 bear market low, the Russell 2000 ETF has made a major technical decision at increments/decrements of 26 (and secondarily at 13 and 52). Now, IWM is at a 26 and 52 point confluence. Up against the aforementioned secular trend line resistance, is Russell 2000 just wrestling through a major “consolidation fulcrum” as it did in 2004-2005 and 2010 before pushing higher; or is it setting up a Primary Top like 2007?
As an opportunistic trader that doesn’t have a vocational or ideological allegiance to bulls or bears, the bearish analytical tilt above might seem disingenuous; but it shouldn’t be – I see broad medium-term equity risk firmly skewed against a further market advance. With that said, while 2014’s consolidation band prevails, shorter-term risk flips in favor of longs the closer Russell 2000 gets to 1080 (TF)/108 (IWM) as it is doing now; and conversely where R2k near 1210 (TF)/120 (IWM). The range – and ultimately, the cyclical bull market – prevails until “the preponderance of evidence” (viz., price) says otherwise. Or as I put it the last time R2k was trading here and on it’s way lower:
Compare $IWM‘s decline to early stage of March-May’s. There’ll be pops, and drops; but all much ado about nothing ’til 120 or 107 give way.
— Andrew Kassen (@andrewunknown) July 17, 2014
Trade ’em Well.
Twitter: @andrewunknown
Author holds no exposure to securities mentioned at the time of publication. Commentary provided is for educational purposes only and in no way constitutes trading or investment advice.


")


 Ready To Break Out?")
