After breaking out to new highs, the stock market has cooled off a bit in August. It hasn’t necessarily gone down, but rather just traded sideways. This has put a cap on the risk on trade in August.
But there are a couple of assets that are pretty telling as to why the market is pausing… and those same assets will continue to play a role in telling investors whether the risk on trade will pick back up.
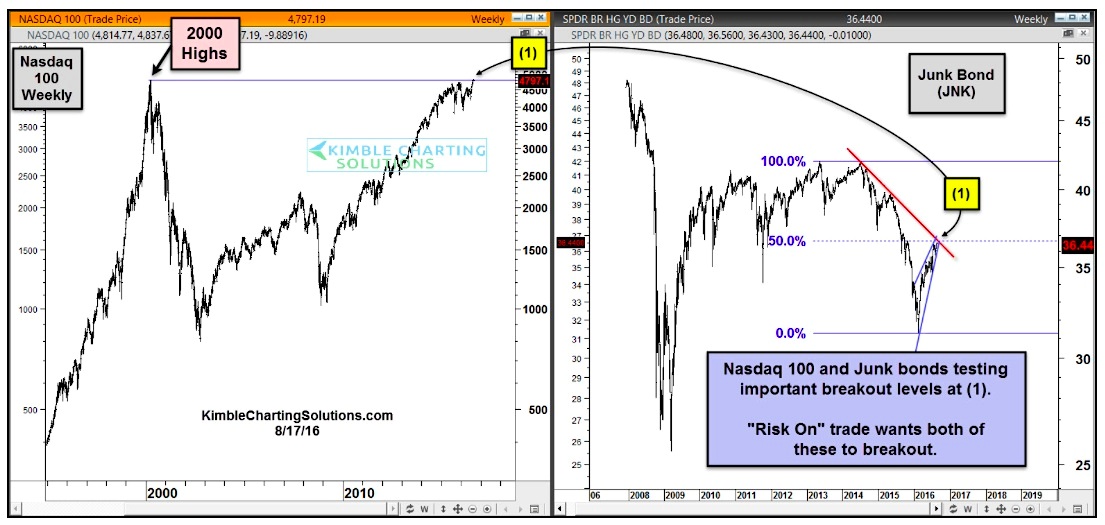
Part of the reason for the hesitation is that the Nasdaq 100 (a market leader, and large-cap tech bellwether) has run into resistance. And at the same time so have Junk Bonds. Below looks at the Nasdaq 100 (INDEXNASDAQ:NDX) over the past 20-years and Junk Bond ETF (NYSEARCA:JNK) over the past decade.
The Nasdaq 100 is currently testing the 2000 highs. And, at the same time, the junk bond ETF (JNK) is testing dual resistance at point (1) below.
The “risk on trade” crowd wants these two market indicators to breakout above the highlighted resistance levels. And should they make good on that, it would send a strong message that stocks are ready to move higher yet.
Thanks for reading and have a fantastic weekend.
Twitter: @KimbleCharting
The author may have positions in related securities at the time of publication. Any opinions expressed herein are solely those of the author, and do not in any way represent the views or opinions of any other person or entity.


 Ready To Break Out?")
")


