 Back in January, I wrote about Retail Sector underperformance and why it was worth watching. It turned out to be a good “tell” of what was to come for the equity markets as the S&P 500 ended up correcting over a 100 points to a low of 1738. Since that low, the S&P 500 has gone on to rally right back to near all time highs, while the Retail Index (XRT) continues to underperform (remaining well below all-time highs). The purpose of the “update” post is to highlight a few things that I’ve been noticing with the Retail Sector over the past few weeks.
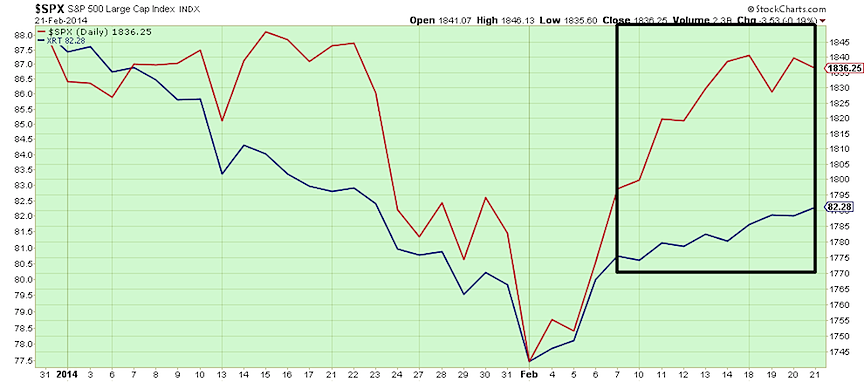
In the chart below, the XRT (blue) has once again started to underperform the S&P 500 (Red). Will this end up being a similar “tell” to the one in January? Or perhaps it will be an early “macro” indicator that equities are getting a bit long in the tooth? Time will tell. In any event, Retailers are out of favor right now.
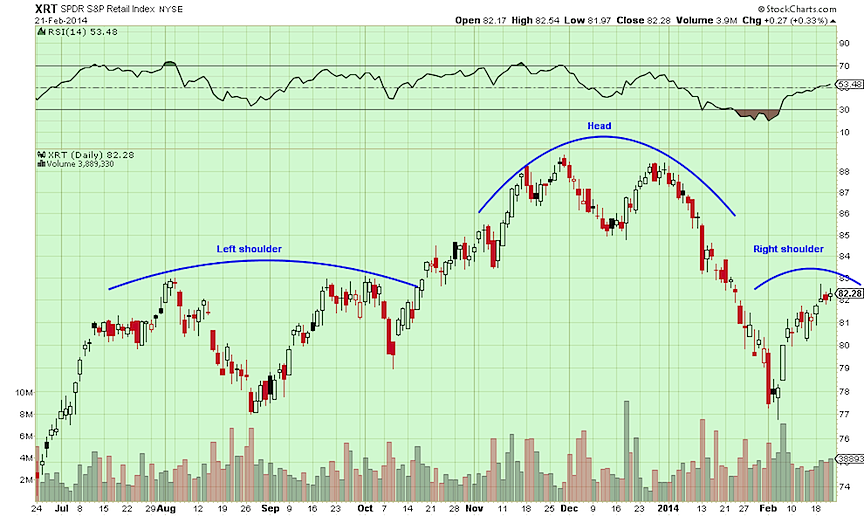
The second chart shows that the XRT Retail Index may be forming a pretty significant head and shoulders topping pattern. Again, this only matters until it doesn’t, but it bears watching… especially if Retail Sector underperformance continues.
Time will ultimately tell how this develops. It’s important, however, to keep your eyes on the XRT. It could provide clues as to where the overall markets are heading. Thank you for reading.
No position in any mentioned securities at the time of publication. Any opinions expressed herein are solely those of the author, and do not in any way represent the views or opinions of any other person or entity.


