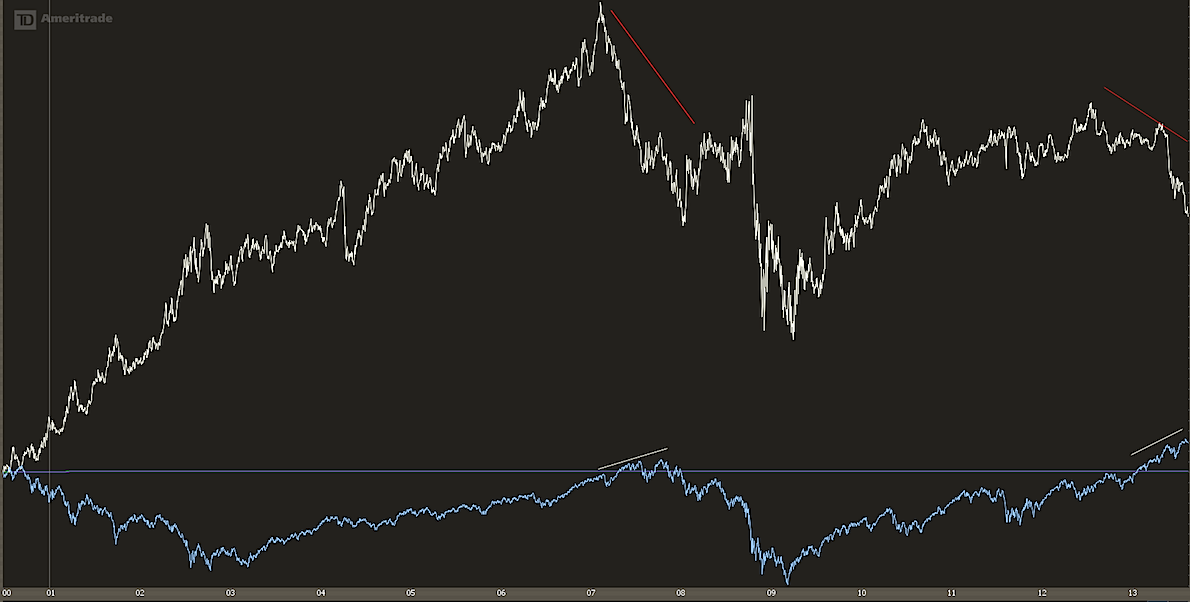
 Real Estate stocks have been weakening since May of this year and haven’t look backed since. Real Estate stocks relative to the S&P 500 have significantly underperformed since July of 2012 and continue to decline at a rapid pace.
Where have we seen this significant divergence before? We saw this divergence back in February of 2007 right before the financial crisis. Am I predicting another crash? No. But it is important to take a look at what certain sectors are saying about, and in relationship to, the current health of the economy.
iShares Dow Jones Real Estate (IYR) vs S&P 500 Chart
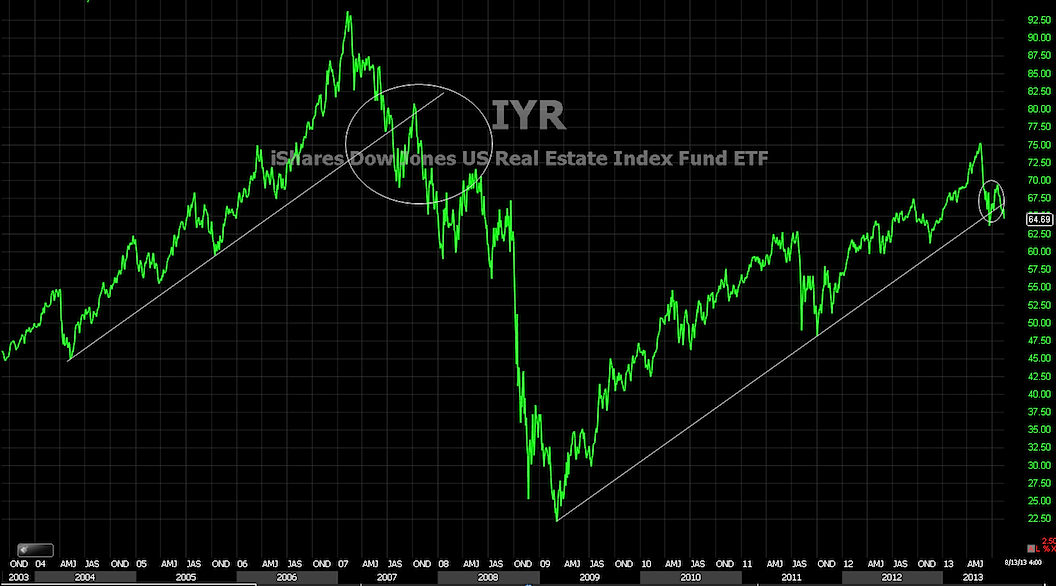
The price chart of the IYR worries me. It currently is trading below a very important trend line that goes all the way back to the 2009 lows. If this is a clean break, it may put serious pressure on equities as a whole, so this is VERY important to watch, even if equities resume highe over the short-term. The last time we saw a significant break was back in 2007, right before the financial crisis.
IYR Chart
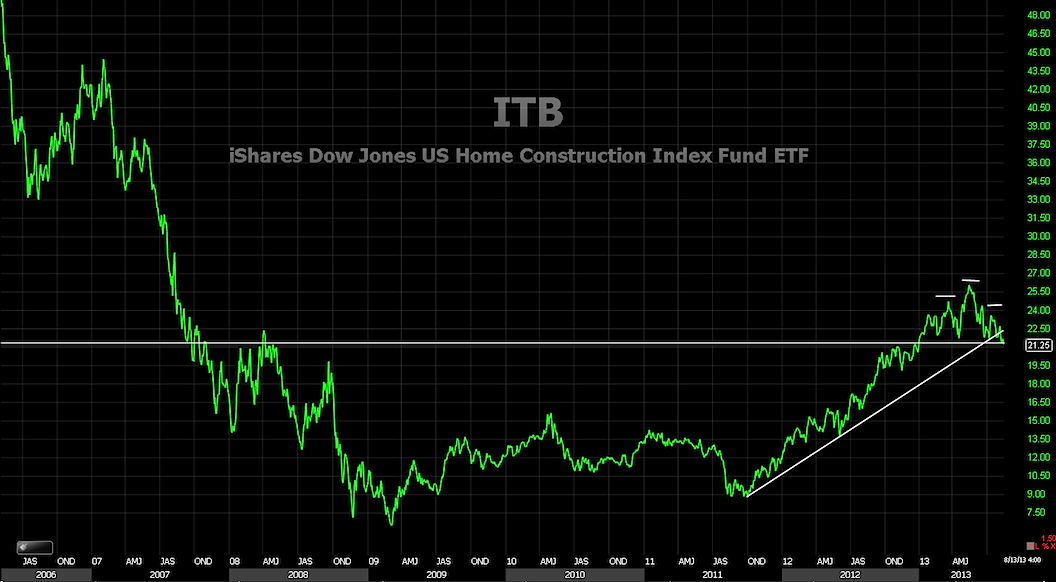
The iShares Dow Jones US Home Construction Index (ITB) has also looked very sloppy over the last few months as well. It looks to be setting up a head and shoulders top which may lead to a further decline which coincides with the weakness in IYR and real estates stocks. ITB also broke an important trend line going back until 2011.
ITB Chart
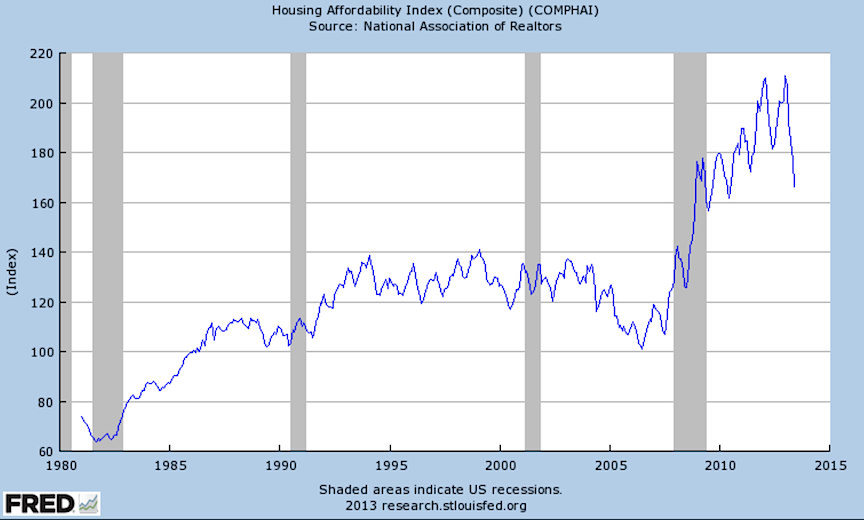
One chart that I follow that is not widely spoken about is the Housing Affordability Index. This chart measures the afford the monthly mortgage payments on a median priced home. A value of 100 means that the family has just enough money to afford a median priced home. The index is currently at 166.0 down from 210.7, about a 21.21% decline which was an all-time high for the index. With the 34% rise in the 30 year mortgage rates since early May, this is the major reason behind the drop in the index.
Housing Affordability Index
These will be a very important themes going forward to see if this will have any major effects on equities. With the FED possibly tapering in September, I believe there will continue to be significant volatility around this sector so be safe out there. ~ Korey
Disclaimer: The material provided is for informational and educational purposes only and should not be construed as investment advice. All opinions expressed by the author on this site are subject to change without notice and do not constitute legal, tax or investment advice. At Castle Financial, securities are offered through Cadaret, Grant & Co., Inc. and TD Ameritrade, Inc. Members FINRA/SIPC.
Chart sources: TDAmeritrade, Worden, and Federal Reserve
Twitter: @stockpickexpert and @seeitmarket
No position in any of the securities mentioned at the time of publication.
Any opinions expressed herein are solely those of the author, and do not in any way represent the views or opinions of any other person or entity.


")


