 By Allan Millar
In my first article we discussed what the Equity Risk Premium is. Now I would like to consider the ways in which it is calculated, a further look at its importance in Finance and then an overview of historical measurements.
Calculating the Equity Risk Premium (ERP)
There are two methods used to calculate the Equity Risk Premium and they provide different answers to the value but both are necessary. Firstly, the geometric mean. Dimson et al (2002 p.181) describe it as measuring the “annualised rate of return that equates the initial investment to the final value of a portfolio”. A simple way to calculate it is to take the nth root of the final value divided by the initial value, minus 1. As mentioned, this is an annualised return and we must recognise therefore that there is no volatility in the figure, although there will be volatility in each of the n years we are considering. As an example, if our portfolio grew to £150,000 from £10,000, over a period of 8 years, we would calculate the geometric mean as follows:
150,000/10,000 = 15. 8th root of 15 is 1.4029. 1.4029 -1 = 0.4029, this is the compound interest rate.
To confirm:
X = 10,000 (1+0.4029)8 gives 10,000 x 15 = 150,000.
If we were looking at a shorter time period, for example five years, we can calculate the geometric mean slightly differently:
Assume that a portfolio has returns of 12%, -3%, 6%, -5% and 10% over five years. First, we must convert the returns as follows:
1.12, 0.97, 1.06, 0.95 and 1.1.
We multiply these to arrive at 1.2034. To complete the calculation we must take the 5th root of this value, subtract 1 and then multiply by 100, to return to a percentage value. This gives us a return over the period of 3.7724%, If we had taken the arithmetic mean, the calculated return would have :
12% + (-3%) +6% + (-5%) + 10% =20%. Divide by 5 = 4%.
Dimson et al (2002) established that to calculate the historical Equity Risk Premium, it is preferable to use the geometric mean as (p.181) it “has intuitive appeal from an investment perspective. It corresponds to the annualised performance figures you see every day for mutual funds, for indexes and for pension plans.” However, for the future we should use the arithmetic mean. Dimson et al (2002) provide an example illustrating that when making decisions about the future we should use the arithmetic mean, rather than the geometric mean. Assume equally likely returns of 25% and -20%, the arithmetic mean is 2.5%. If however the geometric mean is used, the answer is 0: (1+25/100) x (1-20/100) -1. To further amplify this point, consider an investment of £10 with a required return of 2.5%. This would offer probabilities of receiving £12.50 (+25% return) or £8.00 (-20% return). Discounting to arrive at the present values, we have £12.50 / 1.025 = £12.20 and £8.00 / 1.025 = £7.80. With equal probability, we have £12.20 x 0.5 and £7.80 x 0.5, which gives £10. If we used a geometric mean, the return would inevitably arrive at 0. In support of this, we must also remember that if we look at total returns on an annual basis, there will be considerably more volatility than when we examine the returns over a longer time period. Using the arithmetic mean allows one to calculate the return expected in any given year. It is then also possible to calculate standard deviations to determine the range of fluctuations around the mean. This is a topic we will return to when we discuss the prospective ERP.
The Importance of the Equity Risk Premium
We have already seen that the Equity Risk Premium is fundamental to Finance and is a key component of different models. We have also seen that investors need to be compensated for the risks involved in buying equities. This accounts for some of the literature on the ERP but it has generated many other discussions as it is fundamental to the valuation of financial assets. Dimson et al (2002) use the example of the Dow Index and employ the Gordon Growth Model. As this paper is focused on the UK, I will replace the Dow with the FTSE 100 and provide a similar example. On the 11th of April 2012, the index closed at 5,634.74. The dividend yield was 3.2%. Therefore, for a £10,000 investment, one would expect a return of £320. This yield is lower than the historical ERP (by some calculations), therefore investors would probably expect dividends to increase in the coming years. The Gordon Growth Model (Gordon 1959) assumes that dividends grow at a constant rate g and discounts them at the expected rate of return r. This leads to the formula: Value = Dividend/(r–g). There are of course a number of assumptions with this growth model, they are not in the scope of this article but we will briefly consider them later when using Dividends to calculate a prospective Equity Risk Premium.
As discussed above, investors in this example expect dividends to increase over time and we will assume dividends will grow indefinitely at 1%. Let us further assume that the required return is 3.2%. Therefore r–g = 2.2%. Given these figures, the valuation of the FTSE 100 is 320/0.022, approximately 14,545. If the required return had been 6.7% and the dividend growth rate remained at 1%, this would have given a valuation of approximately 5,635. Figure 1 illustrates this relationship:
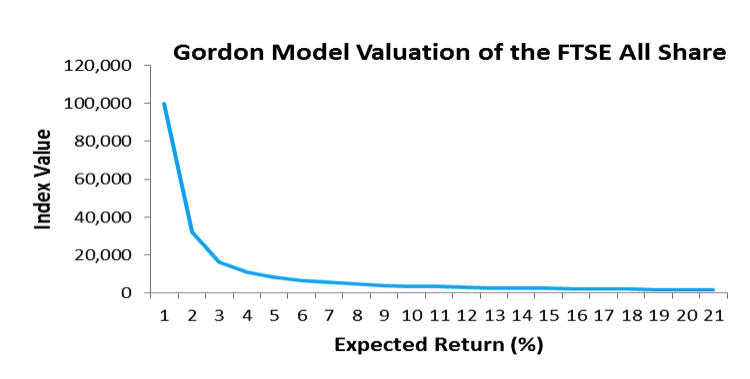
Figure 1: Gordon Model Valuation (assumes dividend of £320 and 1% real dividend growth)
With a constant real dividend growth of 1%, the value of the index varies from infinity, with expected returns at 1%, to 5,333 at an expected return of 6% to just 1,600 at 20%. Taking this simple example, it is evident that the valuation is heavily dependent upon the discount rate. Given what we have read about the Equity Risk Premium and methods of calculation, we will now look at the historical value of the Equity Risk Premium and examine some of the issues surrounding the value.
Measuring The Historical Equity Risk Premium
There are a number of issues presented when looking at historical data and deriving a value for the risk premium. Dimson et al (2002) highlighted the issues in calculating the Equity Risk Premium and proposed certain ways in which to calculate long-term performance. The first point was not to create an index retrospectively as this would then include survivor bias. Secondly, long-term performance must be measured using total returns, dividends must be included. The third point is that the equity index needs to be representative of its market, and ideally be full coverage. Finally, in calculating the historical ERP, the geometric mean should be used. For these reasons, and will be seen in future articles, I have chosen the FTSE All Share as it currently comprises over 600 companies and is more representative of the UK than the FTSE 100. That covers the first and third points and with regard to the second, we will also look at total returns, which will take into account inflation and reinvestment of dividends. We will also consider the impact of not re-investing dividend income and returns will be calculated using the geometric mean. Damodaran (2011) states that even if agreement is reached that looking at historical ERPs is the best way in which to predict the future, there may still be an argument about how far back into the past one should go. We are constrained by the data in these articles so will look at a period of thirty-six years. This need not be a limiting factor though as Damodaran (2011) points out, a shorter time frame may be useful as investors’ risk aversion may change over time and the shorter time frame will adequately capture an updated estimate. The duration of the timeframe may be anything from a few hours to five years, depending upon the investor. With regard to the literature on the historical Equity Risk Premium, there is little consensus on an actual value but broad agreement that it has been overstated. Looking at this topic, Ibbotson (2011) suggested some methods to consider: looking at historical ERPs, using a consensus estimate and investigation of the demand and supply. For this section, we will focus on the first method. To do so, we will refer to the Ibbotson Index series; this is interesting as it provides a range of options to consider when gauging the historical Equity Risk Premium. The data in Figure 2 below illustrate the difficulty in determining a historical Equity Risk Premium. Assuming that the time period is agreed upon, in this case it is 1926 to 2010, academics and investors then must decide which measures will give the best estimation of the risk premium. If agreement is reached on Large Company stocks and U.S. Treasury Bills, the E would be (9.9% – 3.6%) 6.3%. However, if the arithmetic mean was used rather than the geometric, the answer would be (11.9% – 3.7%) 8.2%. As Ibbotson says (2011 p.20) “the ERP historical measure can be anywhere in the range of 4.4–8.2 per cent, depending on which definition of ERP is used”. This variation can also be explained by the use to which it will be put, for example, the time horizon of an individual or the capital expenditure plans of companies.
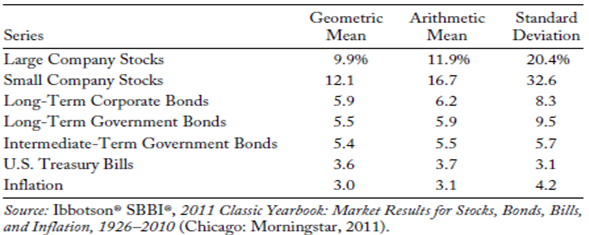
Figure 2: Ibbotson Index Series
To add to the data, Jorion and Goetzmann (1999) estimated a geometric Equity Risk Premium of 2.83% for the period pre-dating Ibbotson’s figures, 1792 to 1925 and, based on thirty-nine countries, 3.84% from 1921 to 1998. Similarly, Fama and French (2002) estimate 2.55% to 4.32% for the period 1951 to 2000 and by way of contrast, Dimson et al (2002 p.185) suggest that the worldwide historical risk premium has been estimated at “approximately 6 per cent”. Fernandez (2008) and Fernandez, Aguirremalloa and Corres (2011) provide further useful information. They contacted a number of Professors, Analysts and Companies asking, amongst other things, for their estimate of the ERP. They received 1,438 replies and the average was 5.5%, with a standard deviation of 1.7%. This gives us a range of 3.8% to 7.2%, similar to the result from the Ibbotson Index and also encompassing Dimson et al’s value. Welch (2000) surveyed 226 financial economists to ascertain a consensus on the Equity Risk Premium. The answer with regards to a 30 year period was 6.8% to 7%, using the arithmetic mean. The geometric mean reduces this to 5.2%. Brealey and Myers (1196 p.145) suggested that 8.2% to 8.5% was the historical Equity Risk Premium. Dimson et al (2002 p.186) comment on Welch’s findings and their importance, pointing out that their “influence extends from the classroom, to the boardroom, to the dealing room, to the courtroom”. They also comment on the value, suggesting that there are subjective factors at play and that when the survey was conducted; we had just experienced a strong stock market performance in the 1990s.
As we can see, reaching a consensus, even using the same data, is problematic. There are a number of ways to address this, which we will look at in my next article as the historical Equity Risk Premium is fundamental to predicting its value in the future.
References
- Brealey, R. and Myers, S. (1996) Principles of Corporate Finance 5th Ed. New York Hill
- Damodaran, A. (2011) Equity Risk Premiums (ERP): Determinants, Estimation and Implications – The 2011 Edition Stern School of Business
- Dimson, E., Marsh, P., and Staunton, M. (2002) Triumph of the Optimists: 101 Years of Global Investment Returns Princeton University Press
- Fama, E, & French, K 2002, ‘The Equity Premium’, Journal Of Finance, Vol 57 Issue 2, p. 637-659
- Fernandez, P., Aguirremalloa, J.,Corres, L (2011) US Market Risk Premium Used in 2011 By professors, Analysts and Companies IESE Business School Working Paper
- Ibbotson, R.G. The Equity Risk Premium Rethinking the Equity Risk Premium (Edited by P. Brett Hammond, Jr., Martin L. Leibowitz, and Laurence B. Siegel) Research Foundation of CFA Institute (2011)
- Jorion, P. and Goetzmann. W.N., 1999, “Global Stock Markets in the Twentieth Century”
- Journal of Finance Vol 54 Issue 3 p.953-980.
- Welch, I. Views of Financial Economists on the Equity Premium and on Professional Controversies Journal of Business Vol 73 No 4 2000
Twitter: @MillarAllan @seeitmarket
Any opinions expressed herein are solely those of the author and do not in any way represent the views or opinions of any other person or entity.


