Volatility has returned to the markets and with it has come increased beta. This likely has many traders rejoicing, but considering the big move yesterday and pre-market move higher today, it may depend on directional bets. That said, the iShares Russell 2000 ETF (IWM) is nearing an important juncture.
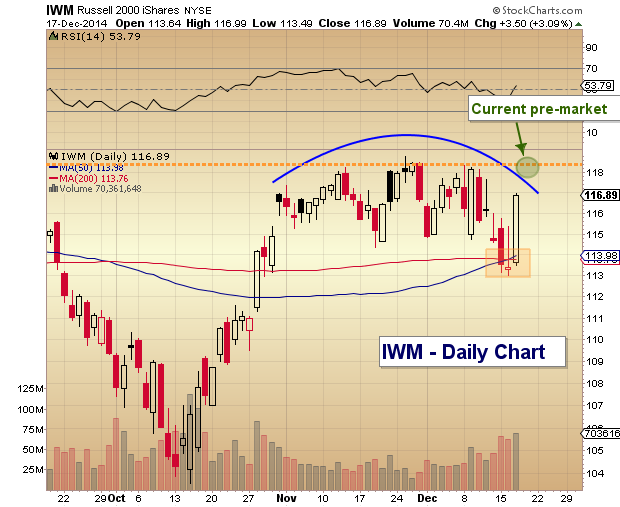
Just two days ago, the Russell 2000 was sitting on the brink of a deeper correction, holding near the intersection of its 50 and 200 day moving averages (I mentioned this level (113.50-114.00) as key support in my last post on IWM). Another concern was the rounded top-like formation (and this is still a concern until a breakout occurs). Pre-market today, IWM is up another 1.5 percent, and a total of 4 percent from those levels referenced above. It is now testing breakout resistance at recent highs. On the bullish side, the ETF has been in a wide consolidation and the 50 day moving average is now rising.
The new range is roughly 113.00 to 118.50… until one of those gives way.
The Russell 2000 has long been a sign of risk-on/risk-off in the equities markets so stay tuned. And trade safe.
IWM – Russell 2000 ETF Daily Chart
Follow Andrew on Twitter: @andrewnyquist
Author carries long trading exposure to Russell 2000 related securities at the time of publication. Any opinions expressed herein are solely those of the author, and do not in any way represent the views or opinions of any other person or entity.

 Rolling Over At Key Fibonacci Level?")


