One of my favorite methods of charting is with Point & Figure charts. Today, I’d like to do a quick recap of the major stock market indices and where they stand – bullish or bearish – in accordance with Point & Figure signals.
I plan to walk through what I’m seeing on the NYSE Composite Index, the S&P 500 Index, and Russell 2000 Index. Please let me know if you have any additional thoughts or questions.
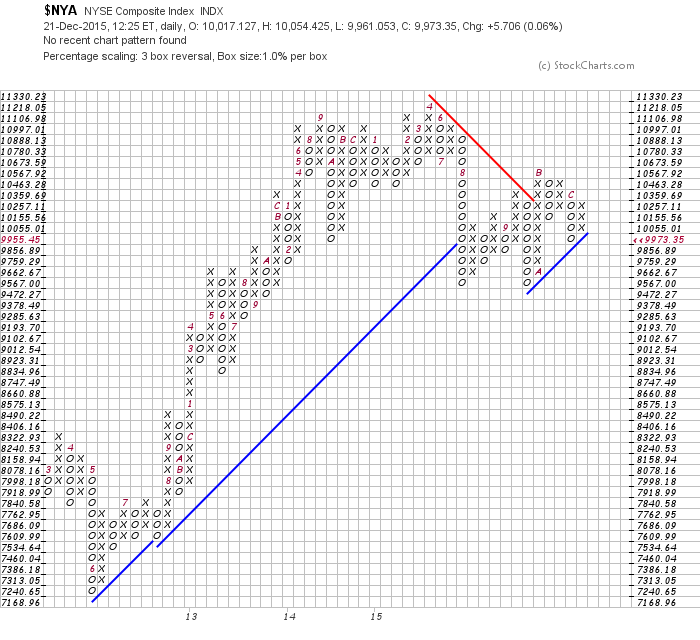
NYSE Composite Index
The double bottom sell signal in August gave way to accelerated selling that broke the trend line off the summer 2012 bottom. A nice bounce occurred with several double top (buy) point & figures signals, one of which broke trend line resistance to establish a new uptrend for the NYSE Composite.
It’s important to note, though, that the last point & figures signal was a double bottom “sell” which tested trend line support.
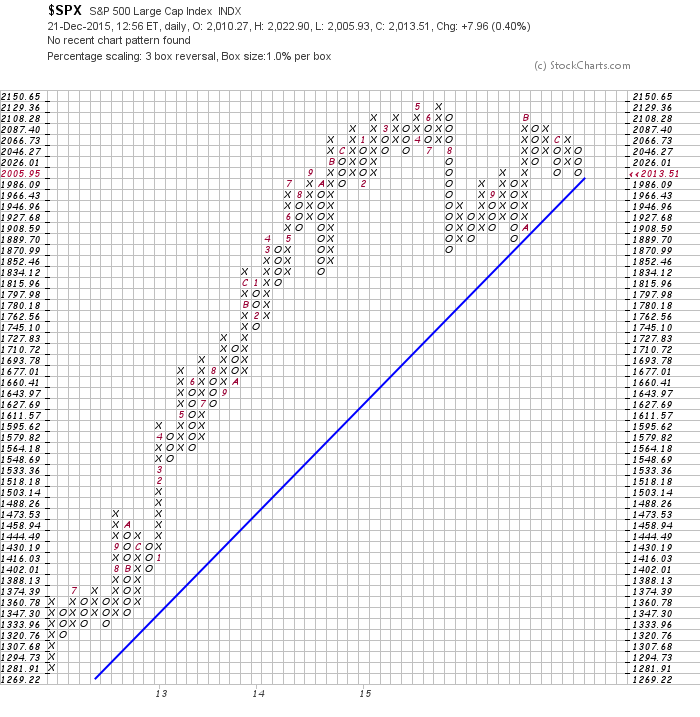
S&P 500 Index
The chart of the S&P 500 (SPX) is showing that we’re at an important point as we are sitting at trend line support which has been in place for over three years. The last point and figure signal generated was a double bottom “sell” which was initiated at the beginning of December. A print of 1986.09 would generate another double bottom sell signal and would be the first occurrence of the trend line being broken. Should this occur, the back to back point & figure signals would likely be warning of more weakness to come. But that’s not today’s business. As well, seasonality suggests an upward bias. Time and price will tell.
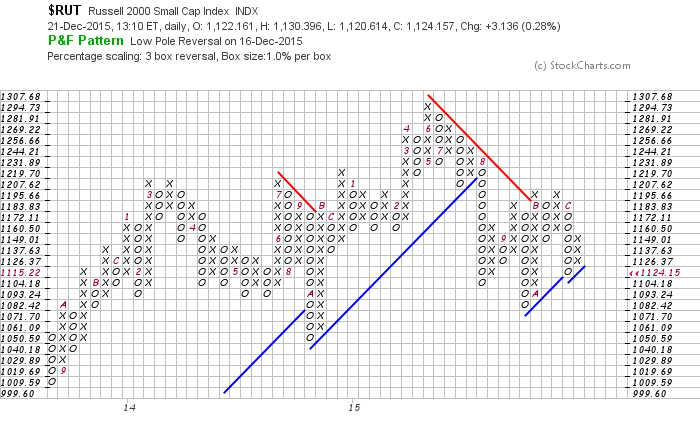
Russell 2000 Index
Looking to small caps, we can see they peaked in June of this year and have continued on a downward trajectory. Looking at the trend lines and you can see that the Russell 2000 (RUT) is trying to put in a bottom however the last point and figure signal was a double bottom sell signal.
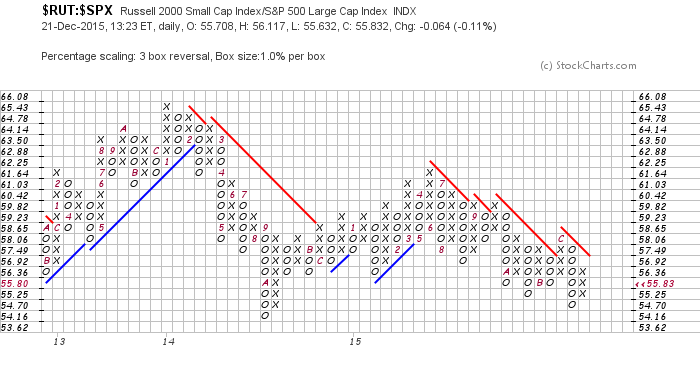
The two things which don’t sit well with small caps are they aren’t participating with the US dollar’s strength, which historically is good for small caps and with more than half of December being over, there isn’t any sign of the January effect. The January effect is a seasonal event which occurs actually starting in December when small caps outperform the broad market. the below chart is a point & figure take on relative strength between RUT and SPX. Clearly small caps have been significantly under performing the S&P 500.
Thanks for reading.
Twitter: @Snyder_Karl
The author does not have a position in any of the mentioned securities at the time of publication. Any opinions expressed herein are solely those of the author, and do not in any way represent the views or opinions of any other person or entity.

 Rolling Over At Key Fibonacci Level?")


