After a nice rally off the March lows, Crude Oil is struggling again… so much so that it is testing those March lows already. For now, Crude Oil is oversold and likely to bounce, but the Point And Figure chart below for WTIC doesn’t look promising at all.
The recent collapse in prices has taken it’s toll.
Crude Oil Point & Figure Chart
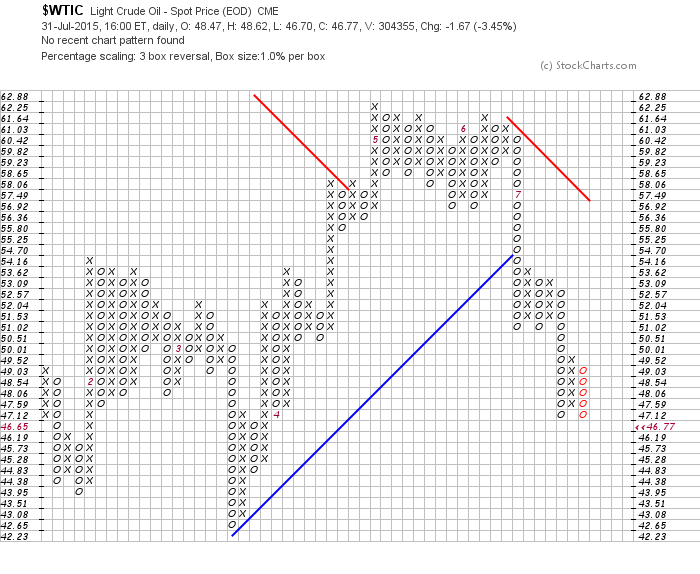
It appears that the sharp rally that followed the “lows” earlier this year was a strong counter trend rally within the context of a larger bear market. The triple bottom sell signal generated in July offers a price objective below $30 a barrel. Before we can see a move of that magnitude, though, let’s keep in mind that there is support for WTIC Crude Oil in the mid and low 40’s. So a respite rally here makes sense.
A break below $40 a barrel would open the door for much more weakness. It’s also worth noting that if the current down column sees a 46.65 print another sell signal will be generated.
Thanks for reading and have a great week.
Twitter: @Snyder_Karl
Any opinions expressed herein are solely those of the author, and do not in any way represent the views or opinions of any other person or entity.


