There is something very broken with Palladium. The drop in price has accelerated into September and created one scary chart for traders. This shouldn’t be entirely shocking, though… at least, if you have been following my thoughts and analysis on this subject.
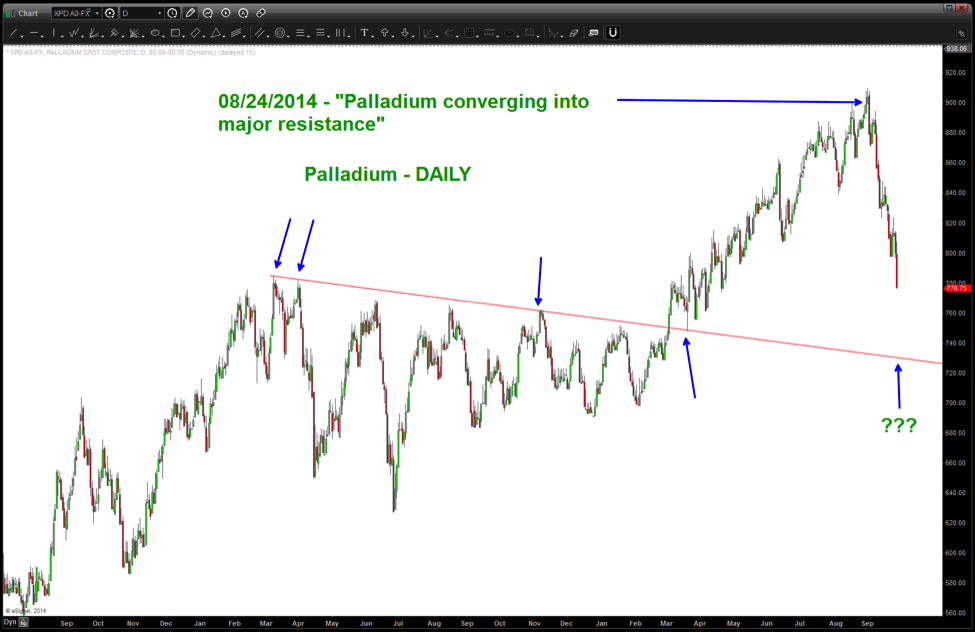
The continuous liquidation comes on the heels of my late August post on BartsCharts.com, wherein I highlighted the completion of Palladium’s pattern higher. Since that time, it’s been all downhill for the metal.
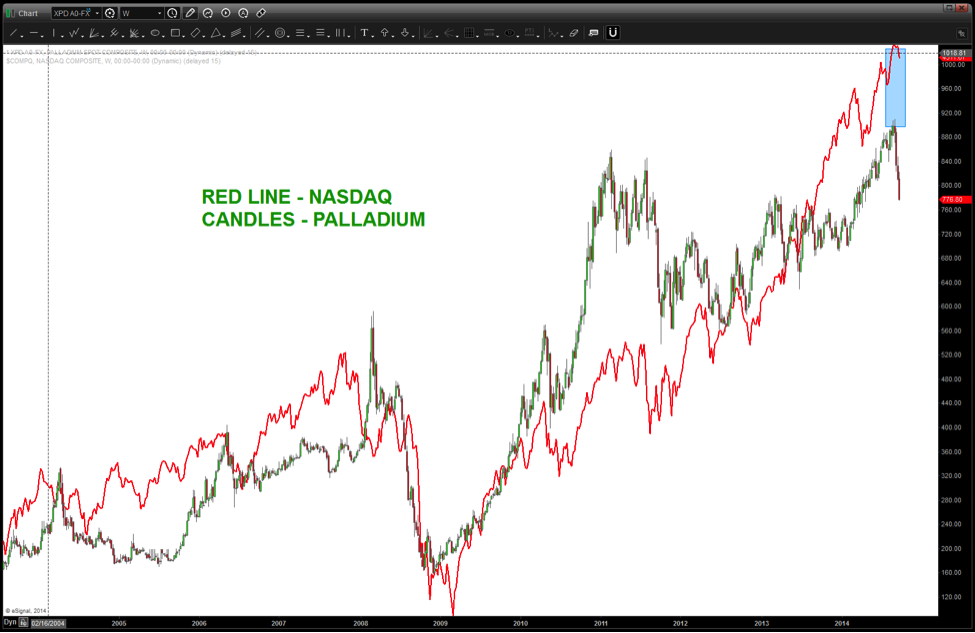
This is important because I think there’s a correlation between Palladium and the NASDAQ and Apple (APPL). In the past, when the NASDAQ and/or APPL have shown a divergence with Palladium, it hasn’t taken long for them to show weakness as well. So this is something equity investors will want to monitor closely. And further, if the chart holds true to form, I believe that there is more downside to come (although I expect the red descending trend line to offer support).
Palladium Price Chart
In the chart below, you can see the correlation between Palladium prices and the NASDAQ. Recent weakness in the NASDAQ has been contained, but should be watched over the coming weeks. Thanks for reading.
Palladium Prices vs NASDAQ Chart
No position in any of the mentioned securities at the time of publication. Any opinions expressed herein are solely those of the author, and do not in any way represent the views or opinions of any other person or entity.

 Rolling Over At Key Fibonacci Level?")


 Rolling Over At Key Fibonacci Level?")
