Late last year, the markets began to show some signs of weakness. Cracks were showing up under the surface, investor sentiment was getting frothy, and volatility was back en vogue. All signs of caution. With this in mind, it shouldn’t be too surprising that the stock market decided shake, rattle, and roll in January.
But what was even wilder, was that the equity market’s turning points throughout the month created a firm trading range. Perhaps we should call it the range of uncertainty for stocks. Check out the chart below of the SPDR S&P 500 (SPY).
S&P 500 ETF (SPY) – 60 MIN Chart Of January
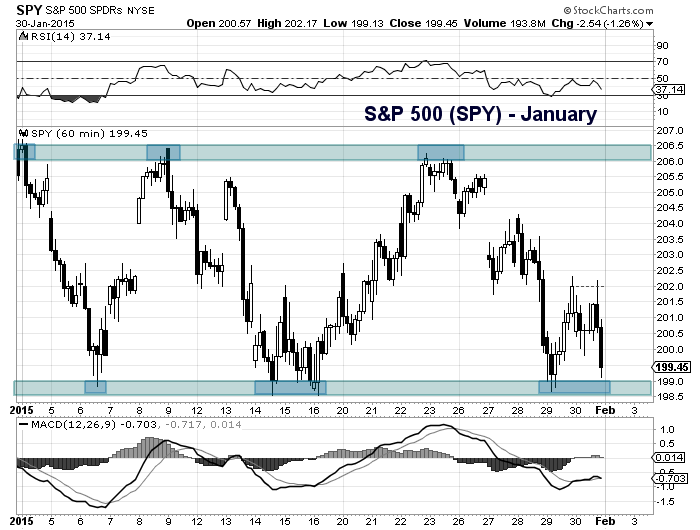
The S&P 500 ETF (SPY) traded in a range of 198.50 to 206.50 for the whole month. On the S&P 500 cash index the trading range was 1988 to 2064. That’s what we call market “chop.” This is great for skilled traders that enjoy taking what the market will give them. But dizzying for trend or momentum traders and longer-term investors. Best to look for relative strength while keeping position sizes in check (my opinion).
The lower end of the trading range will remain in focus into early February as the markets will decide if lower supports will hold. Economic data has been a bit soft and the strong dollar has emerged as a concern. Currently, we are just 5 percent off the lows. Depending on your angle, that can be taken as bullish or bearish. Perhaps February will provide more direction to this market.
Check out my S&P 500 Update from last week for more levels and key indicators to watch. Thanks for reading.
Follow Andy on Twitter: @andrewnyquist
No position in any of the mentioned securities at the time of publication. Any opinions expressed herein are solely those of the author, and do not in any way represent the views or opinions of any other person or entity.


")

 Ready To Break Out?")

