The market is under pressure and traders are eager to answer the question: will the S&P 500 (SPX) once again bounce off the channel it has neatly traded in since 2012 or endure a deeper pullback? The following three charts derive insights from Oil and Elliott Wave Theory to offer further perspective about where the market is trading and the support levels that traders will be keying in on in the coming weeks if the selling pressure expands.
First, let’s look at the weekly chart of the S&P 500 (SPX) in Figure 1. The chart demonstrates two important channels that have provided support and resistance guidelines since 2010. The red channel ( in Elliott Wave nomenclature, the “primary channel”) is the channel the market has traded since 2010. The green or “intermediate channel” noted is the tighter channel the market has traded since finding a floor in Summer 2012. From this picture, we see that the SPX has been bumping along the tops of both channels for some time. As we’ve seen, the market is hesitant to trade above the tops of these channels, and will come under selling pressure. The selling pressure, however, has not been able to penetrate below the intermediate channel in green. In fact, it is now closing in on two years since the market has corrected greater than 10% or traded below its intermediate channel.
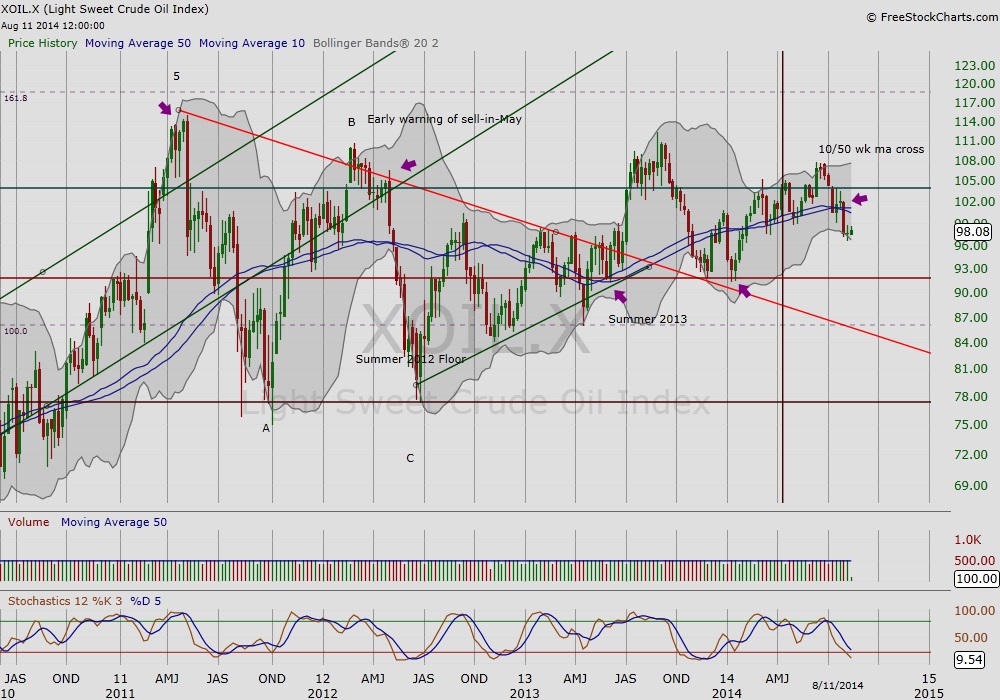 Figure 1 — S&P 500 (SPX): Weekly
Second, earlier this week the market again bounced off the bottom of the intermediate (green) channel as shown in daily chart of the SPX in Figure 2. However, it is worth noting that the 10/50 day moving averages are tightening, perhaps ready to cross, a potential indicator for more bearish action to come. Then, note the behavior of Light Sweet Crude Oil (XOIL.X) in Figure 3. Last month we shared the lead/lag story of oil and equities, and oil has since lead the general market’s selling pressure. Light Sweet Crude Oil’s 10/50 week moving averages have crossed with oil trading below it. If the lead/lag story follows the script written in recent years, then it would be prudent to watch oil’s behavior as we watch the SPX for any follow-through.
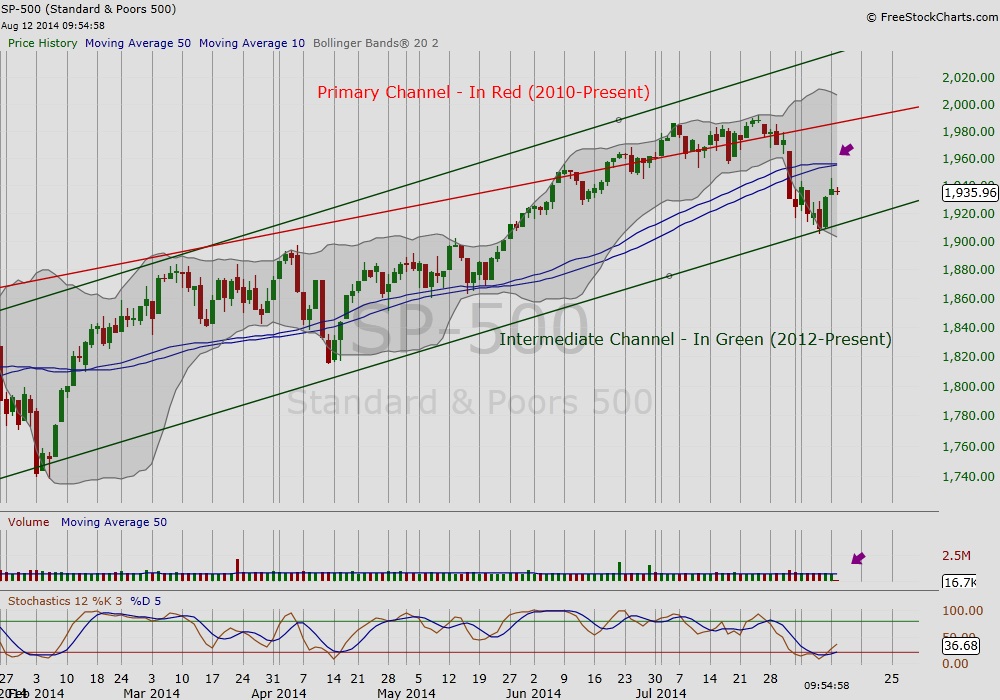
Figure 2 — S&P 500 (SPX): Daily
Figure 3 — Light Sweet Crude Oil Index (XOIL.X): Daily
Key support and resistance lines worth watching for oil is the 10/50 week moving average on the upside and support at around $92. This support level has been tested three times since 2013. Turning back to SPX, looking beyond its intermediate channel we see that it is still trading above its 10/50 week moving average. We can expect some hesitation at the 10/50 week moving average if the bears regain control and break the support of this intermediate channel.
Elliott Wave Guidelines
If further capitulation by the bulls follows, we might turn to Elliott Wave Theory for guidance. In Figure 1 above I’ve identified the Intermediate Wave 3 to be the top from May 2013. Given this scenario, if we measure intermediate wave 1 (green channel) as the low from summer 2010, to the high in May 2011 (when the Euro Crisis began to peak), you’ll note that this distance is equal to the summer low in 2013 (intermediate Wave 4) to the present. Following EW principles, we then look at Summer 2013 for guidance (Frost & Prechter, p. 136) as a potential area of stronger support. However, we are getting a bit ahead of ourselves, and for now will watch how the market addresses the near term supports at the lower green channel and the 10/50 week moving average.
Thank you for reading.
Reference
Frost and Prechter (2006). Elliott Wave Principle: Key to Market Behavior. New Classics Library: GA.
Charts from FreeStockCharts.com
On Twitter: @rinehartmaria
No position in any of the mentioned securities at the time of publication. Any opinions expressed herein are solely those of the author, and do not in any way represent the views or opinions of any other person or entity.


