It’s been a very sideways stock market this fall. But the monthly transition out of September has seen some October stock market weakness. And the latest move lower in the S&P 500 (INDEXSP:.INX) briefly punctured the 2,120 level that I have talked about quite a bit (see chart below). The environment still feels a little Jekyll & Hyde to me.
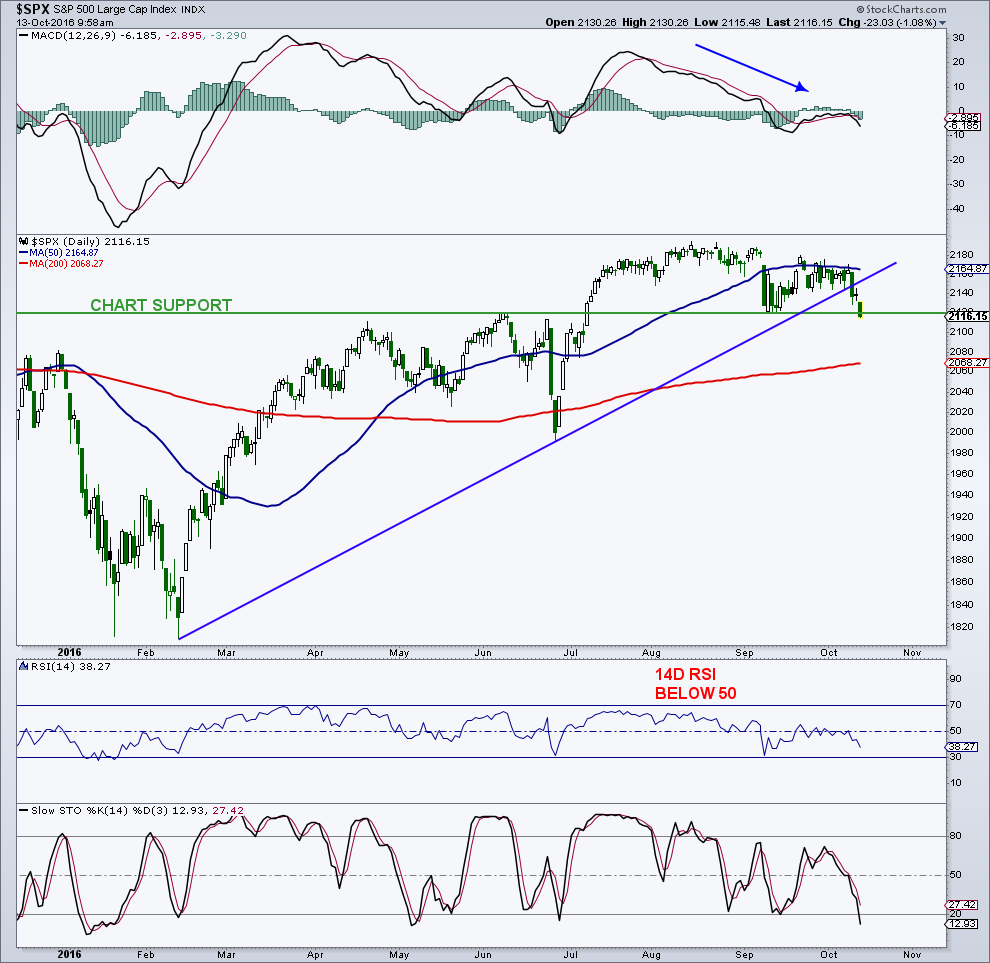
At mid-day, the index is trading back above that level, so much depends on the bears resolve. That said, there is still a possibility that this gets a little ugly near-term. If 2120 is breached, the next major support levels below are at 2,068 (200-day moving average) and 1,992 (chart support).
As I said in my recent reports, the daily MACD remains in bearish territory and the 14-Day RSI remains under 50. These are danger areas for the S&P 500 with most price damage taking place with this combination.
Even so, I will use weakness to layer into this decline as I’m expecting this October stock market weakness to resolve to new highs.
S&P 500 “daily” Chart
You can contact me at arbetermark@gmail.com for premium newsletter inquiries. Thanks for reading.
Twitter: @MarkArbeter
The author has a long position in S&P 500 related securities at the time of publication. Any opinions expressed herein are solely those of the author, and do not in any way represent the views or opinions of any other person or entity.

 Rolling Over At Key Fibonacci Level?")

 Rolling Over At Key Fibonacci Level?")


