I was quoted by my friend Anora Mahmudova of MarketWatch recently in this article about how October gets a bad wrap as a bearish month, but it is actually a strong month.
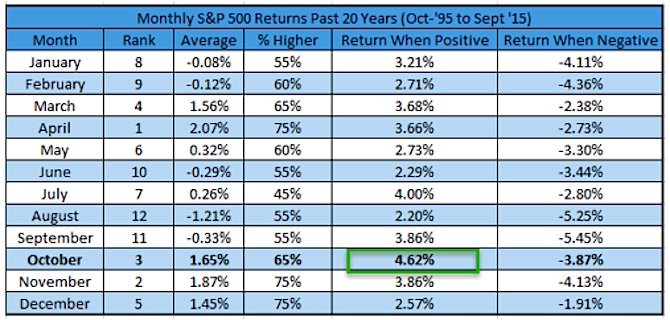
In fact, over the past twenty years, October is the third best month.
Even more impressive is when it is higher, no month sports a higher return when it is up. Meaning, when things are good, they are really good.
But when they are bad… well, maybe stock market volatility kicks up a bit in October. But more on that later.
Monthly S&P 500 Returns For October – 1995-2014
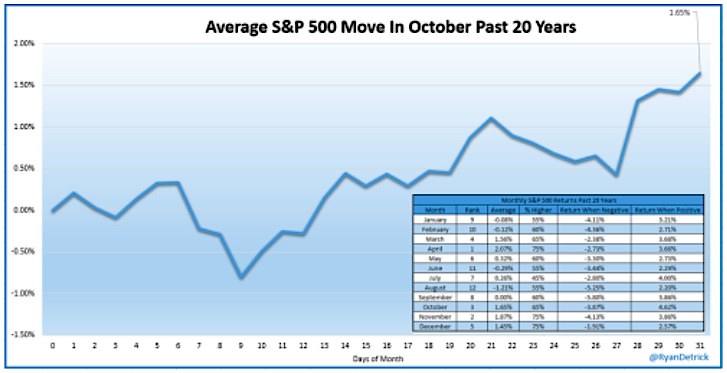
Here’s what the average October looks like for the S&P 500. Not all that scary, huh?
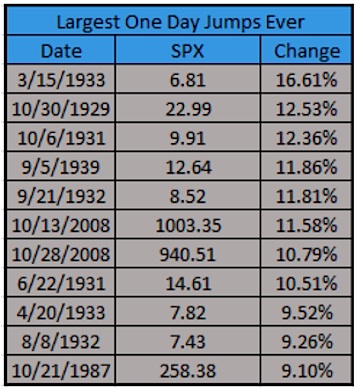
Now let’s dig into October’s history of stock market volatility.
First, let’s look at the largest daily gains ever. Note that five of the top 11 took place in October.
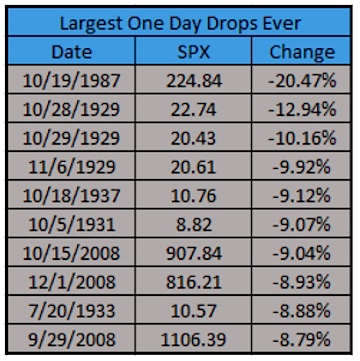
On the downside, the three largest declines ever took place in October and six out the ten largest happened this month.
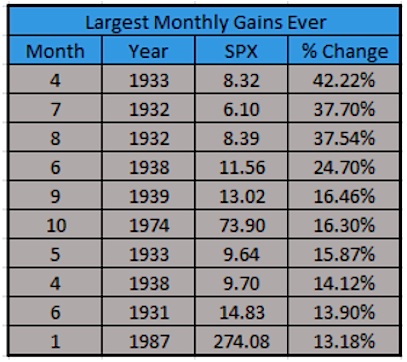
Looking at how the month ended up, just one of the 10 best months ever took place in October.
continue reading on the next page…


