Like few other times in history, US stocks have just enjoyed a year of exceptionally low volatility. It was a period during which the wisdom of sophisticated portfolio managers at the helm of alpha-starved funds was made foolish by the constant sardonic refrain of “BTFD”. The meaning of “smart money” came to connote something other than “well-connected” and “epistemically privileged” as market intelligence became less a thing imputed by circumstances and more a function of behavioral discipline. Maybe the environment was created by low rates, supported by record corporate profits, catalyzed by an accommodating Fed and carried forward in a virtuous loop of investor and consumer confidence; but it was capitalized on best by those who deployed or adapted to a – mind-numbingly simple – process of buying the dip.
That brings us to the latest pullback. For a variety of reasons, it seems different – the damage dealt uneven. Depending on your exposure, you’re reaching this weekend for a band-aid; or wondering if this one cut might need stitches. And some “heavily-involved” momo players in “hot sectors” who “don’t use things like stops” will wake up Saturday afternoon groggy from the post-amputation ether this week administered.
But how different is it? We’ve explored this from a few angles over the past week on See It Market; what follows here is a simple glance back at the pullbacks of the last 12 months on the S&P 500 (SPY), NASDAQ 100 (QQQ) and Russell 2000 (IWM). There’s no universally-held definition of what “pullback” (or “dip”) means, so let me lay out the criteria used. A pullback:
- Assumes an up-trend (no problem there)
- Follows a “higher high” in price that is made in the direction of the prevailing trend
- Measures -2% or more from absolute peak to absolute trough (i.e. not closing prices)
- Crosses below the previous higher high from which a pullback began at its own absolute trough
With those points in mind (no worries: I’ve highlighted all the applicable periods), check them out.
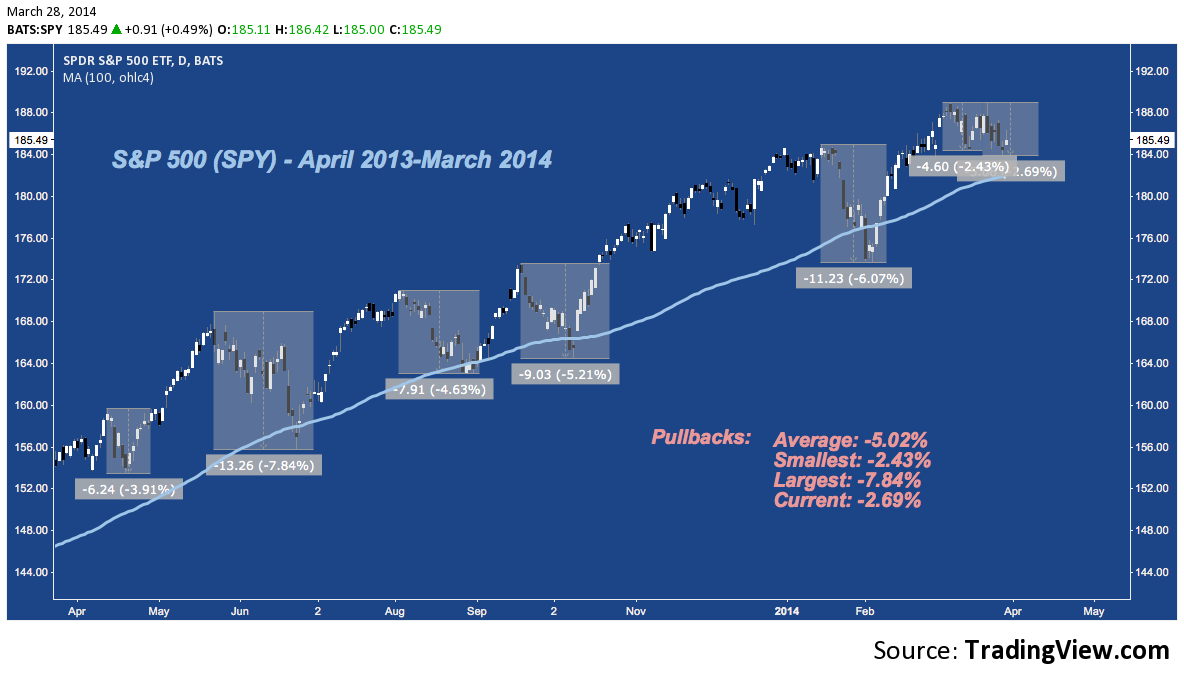
S&P 500 (SPY) Pullbacks – April 2013-March 2014:
SPY‘s current dip is the second smallest of the last year to date, only 25bps off first place. It’s barely half the average pullback and only 1/3 the range set by last May-June’s -7.84% monster. The only thing remarkable enough to note here how utterly unremarkable this pullback is: especially against the performance of SPY‘s peers.
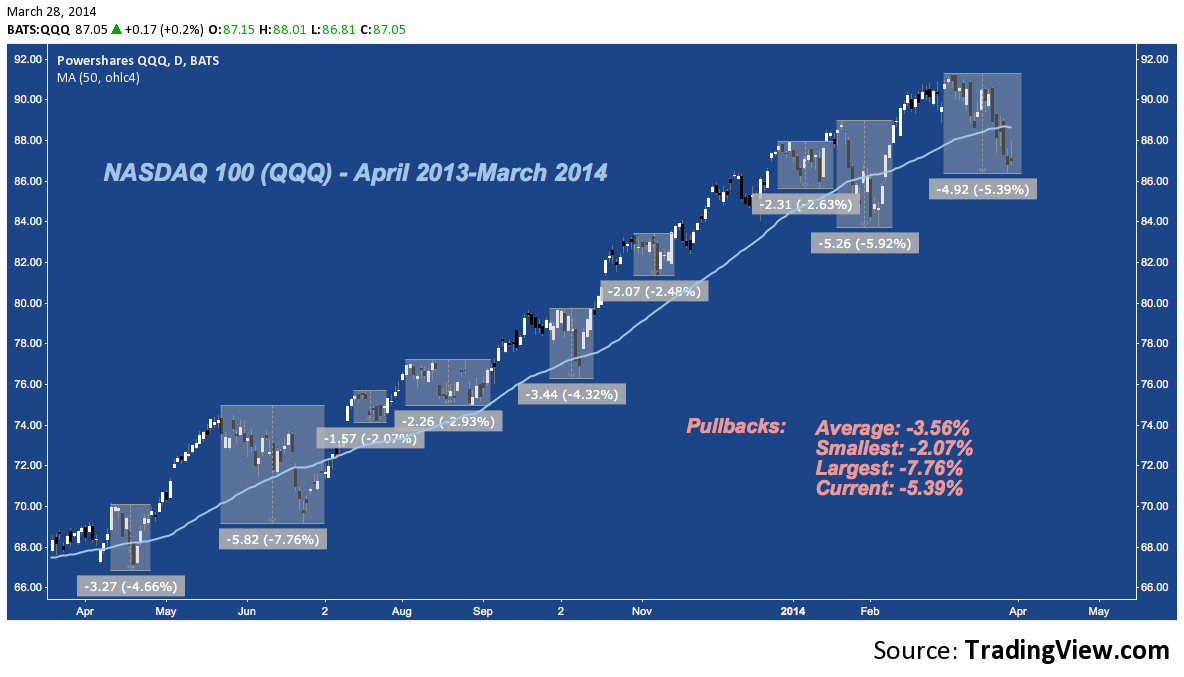
NASDAQ 100 (QQQ) Pullbacks – April 2013-March 2014:
QQQ‘s performance is 3rd worst of 8 over the last year at -5.39%, not far off the #2 space, occuped by January’s -5.92% pullback. Does this market feel like January? According to the Cubes, yes. According to the S&P, it’s not even half as bad. That, in so many words, explains the notion QQQ is getting disproportionately hammered. It is.
Though IWM‘s pullback is deepest, QQQ‘s is the worst v. it’s average. Both exceed their average pullback: IWM by -0.94% and QQQ by -1.83%. As a result, the Russell 2000 is enduring a slightly worse pullback, but the severity of NASDAQ 100’s in the context may make it seem greater.
It’s also worth noting that last April’s pullback saw IWM outstrip SPY‘s pullback range by over 50% (-221bps), with QQQ‘s drop landing in the middle, just like the current pullback. With April in the lower-left of each chart, it’s easy to see how bearishly the large cap outperformance didn’t play out.
Russell 2000 (IWM) Pullbacks – April 2013-March 2014:
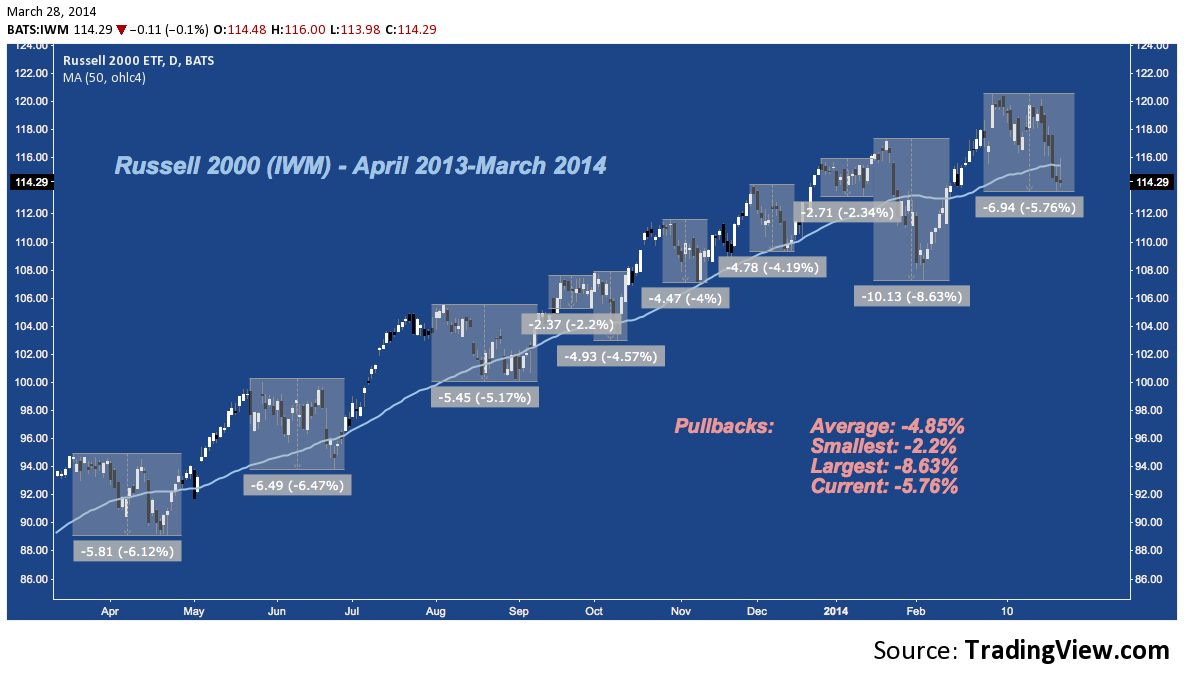
There are exceptions (e.g. last May/June, IWM outperformed) but you’ll catch as you scroll up and down across these charts that it is typical for SPY to assume relative strength leadership on pullbacks, with QQQ the middling performance and IWM‘s high average beta sinking it fastest. That’s customary even when small caps are the perennial outperformer, as they have been for several years running. That looks poised to change, and with it the benign period of blindly buying the dip will likely pass away.
Twitter: @andrewunknown and @seeitmarket
Author carries net short Russell 2000 exposure at time of publication. Commentary provided is for educational purposes only and in no way constitutes trading or investment advice.
Charts courtesy of tradingview.com. Man/Computer Image courtesy someecards.com.
Any opinions expressed herein are solely those of the author, and do not in any way represent the views or opinions of any other person or entity.
 Ready To Break Out?")


 Ready To Break Out?")

