Despite yesterday’s selling, the NYSE Composite (NYA) is trading within 1% (and came within 0.1% at 06/11’s intraday high) of completing the massive harmonic ABCD pattern that has been unfolding on it since the March 2009 bottom. Up a cumulative +161.7% v. the S&P 500‘s (SPX) 193.25% over that period through Monday’s all-time highs, NYA is a broader cap-weighted index of 2000 issues carrying substantial foreign exposure (almost 20%, with 55 of the top 100 constituents non-US companies).
Versus their 2007 cyclical peaks, through Monday’s highs NYA is +5.3% net compared to +24% on the S&P 500.
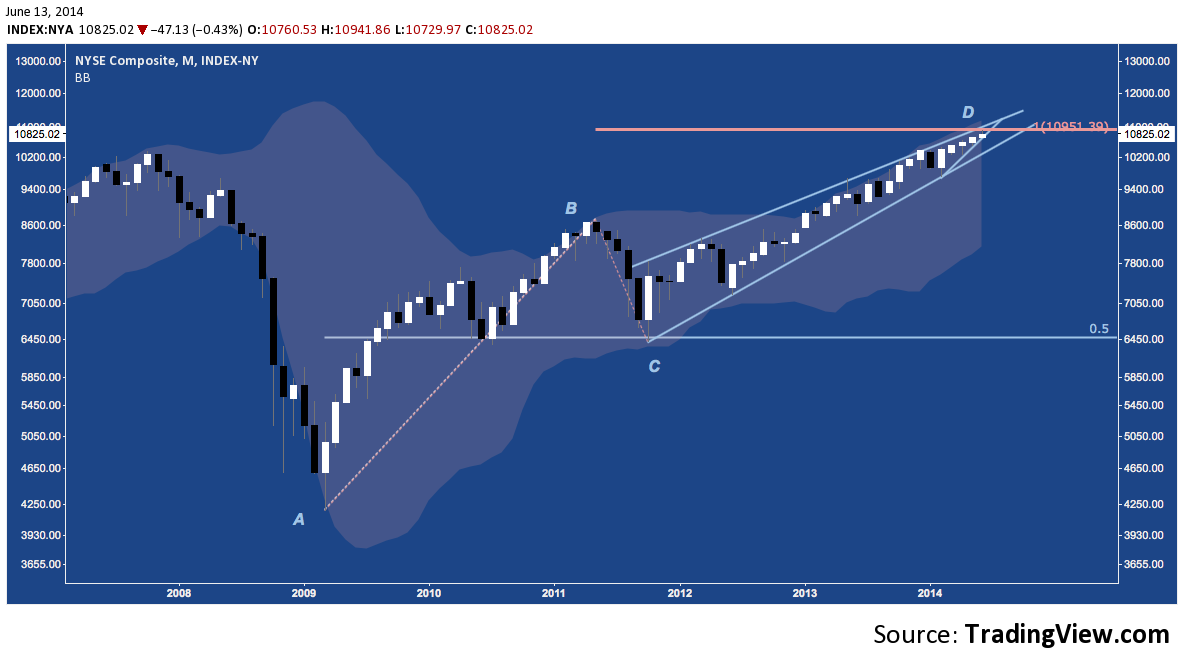
Will NYA break higher from this long-awaited bullish target; or turn lower? Will it even acknowledge it? Consider the precedent SPX provides through interaction with it’s own post-2009 100% ABCD target:
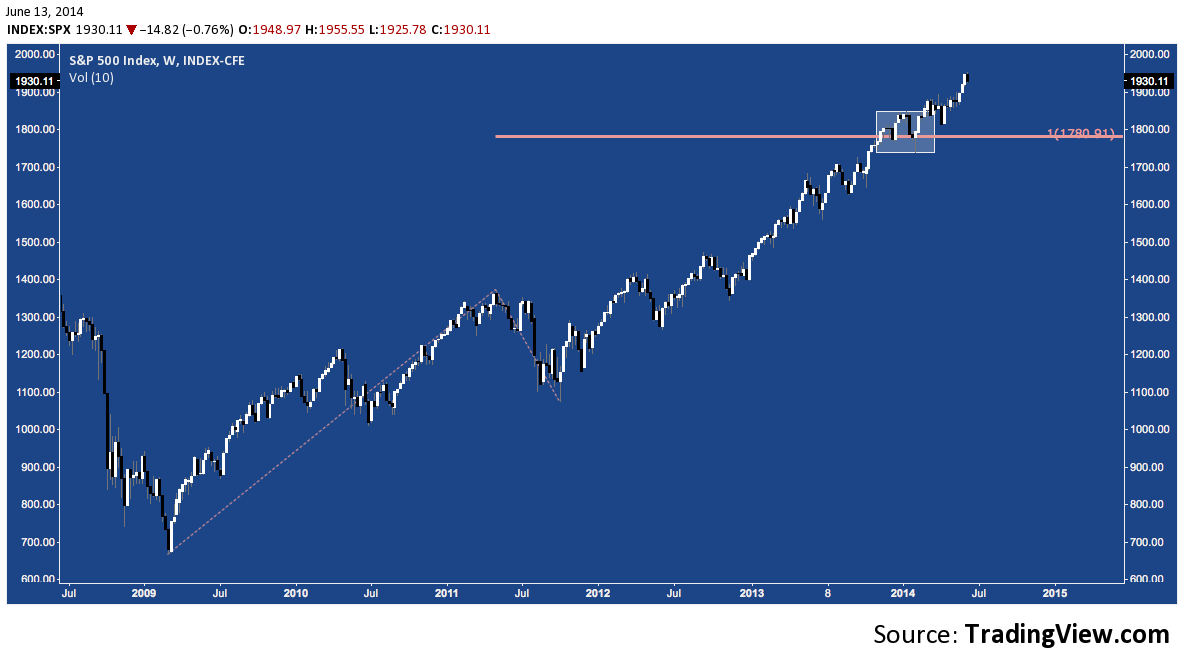 The S&P broke through this level (near 1780) in early-November 2013, pulled back to it a month later; advanced and then installed a more substantial pullback to it in January/early February this year. In fact, in a very strong technical affirmation of the November breakout, the key hammer installed on SPX in the first week of February that opened on this line, broke below but then closed above it, sparking the ~10% rally that has unfolded since. NYA may experience a similar period of consolidation through the Summer (along with the broader market) before finally confirming or failing from this level.
Twitter: @andrewunknown and @seeitmarket
Author holds no exposure to instruments mentioned at the time of publication. Commentary provided is for educational purposes only and in no way constitutes trading or investment advice.


