November Soybeans are enjoying a nice multi-week rally. Similar to other Ag commodities, this rally comes on the heels of several months of pain. To be sure, this latest rally doesn’t mean that the bottom is necessarily “in” for select commodities, but it does breathe new life into the sector for 2014.
Looking at a daily chart of November Soybeans, two things stick out to me:
1) The sling shot rally started with a Relative Strength Index (RSI) divergence with price: The RSI put in a higher low while Soybeans hit a new price low (bullish).
2) The rally is V-shaped and vertical. Some consolidation may be necessary if higher prices are in the cards.
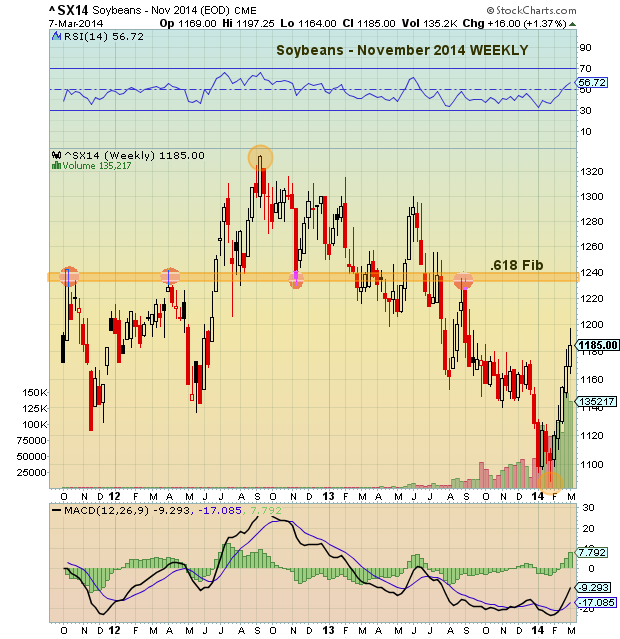
 Turning to the weekly chart of November Soybeans, we can see a confluence of resistance that may serve as a price target/magnet over the coming weeks. This comes in around 12.30/35 (representing a lateral resistance zone and the .618 Fibonacci from the 2012 highs). I don’t’ see much higher than 12.25-12.30 over the near-term, as a falling 200 day moving average likely requires consolidation at some point.
 Trade safe.
No positions in any mentioned securities at the time of publication. Any opinions expressed herein are solely those of the author, and do not in any way represent the views or opinions of any other person or entity.


