 By Jeff Wilson
For the finale of this 3 part series, we will look at traditional and non-traditional economic indicators that support the thesis that economic development is happening and furthermore, that money is flowing into the equity markets of Southeast Asia. We will also transition our economic analysis to that of the region’s equity prospects by analyzing pricing charts of individual country ETFs. For more on the Southeast Asian economy, be sure to read Part 1 and Part 2.
Wine consumption per capita:
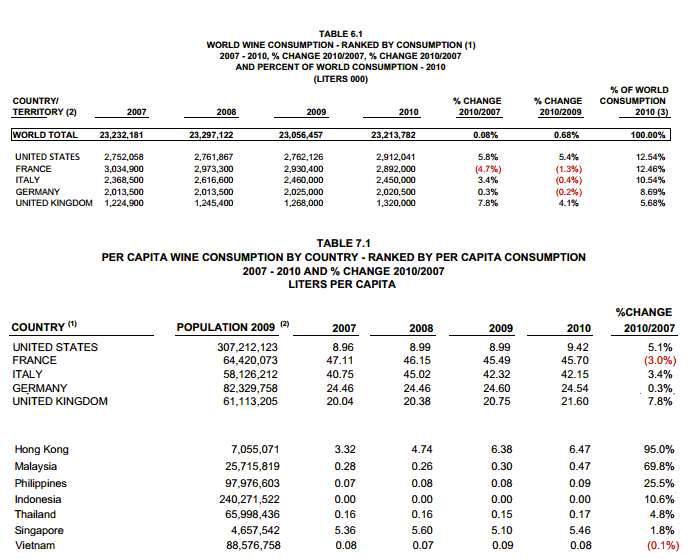
I have yet to see a statistical research paper that shows economic development is a major determinant in increased wine consumption. However, I have come across some articles that showing that wine consumption decreases in times of economic downturns. Wine is categorized as a consumer discretionary and thus it would make sense that individual and families’ economic standing affect their ability to consume wine. Additional disposable income or the perception of having additional disposable income, in theory, should increase consumer discretionary purchases. So I thought it would be of interest to look at wine consumption per capita across the top 5 countries versus the Southeast Asian countries that we’ve been talking about. Click chart below to enlarge.
Sources: Wine Institute – Consumption by Volume & Wine Institute – Consumption by Country
You can see how the total consumption of wine per capita of these nations pale in comparison to the countries traditionally known to be big consumers of wine. However, the rate of growth in per capita consumption especially for Hong Kong, Malaysia and the Philippines support the thesis that there is an emerging consumer class eager to put disposable income to work.
Portfolio Equity Inflows:
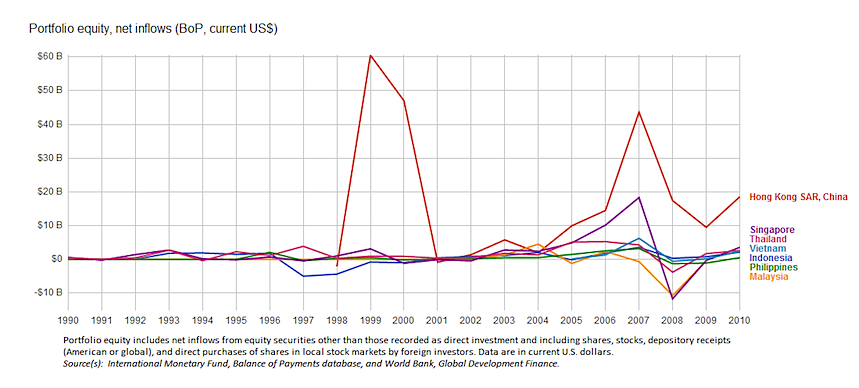
As much as I have written about socio economic factors and how they support the thesis that this sub region is on a path for sustained growth, unless there is concrete evidence that institutions are also pouring money into the area, it doesn’t do much for retail investors and traders. Thus, this last chart is a vital tool that we must keep track of. As long as the general trajectory is up, it bodes well for these countries’ bourses.
But investing in this region comes with a bit of caution: As with most markets considered emerging or frontier, these countries are considered to be at the riskier end of the spectrum so investors must monitor these investments with care. For example, investors should note that global events that necessitate a risk off approach may lead to a liquidation of these riskier type of assets. Click chart below to enlarge.
ETF charts and Investing Analysis:
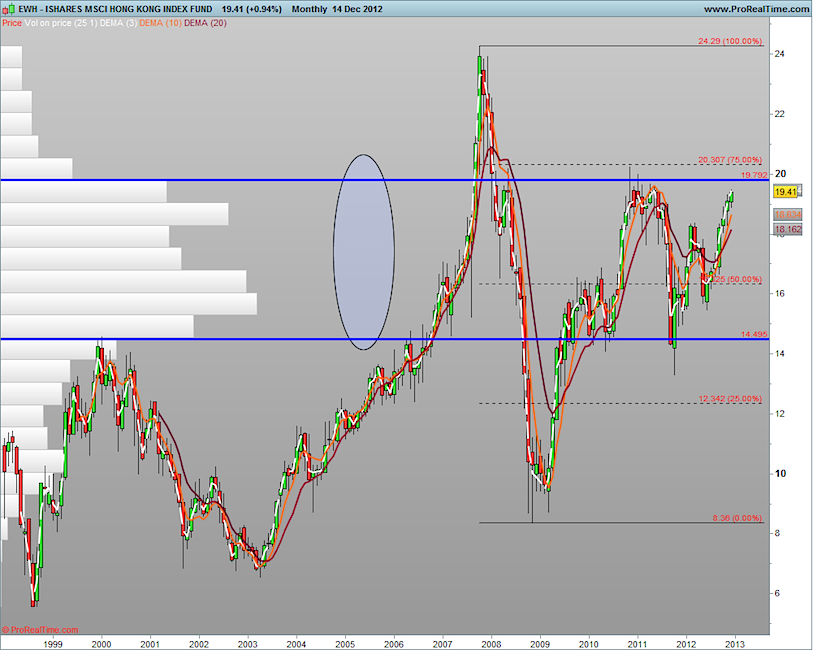
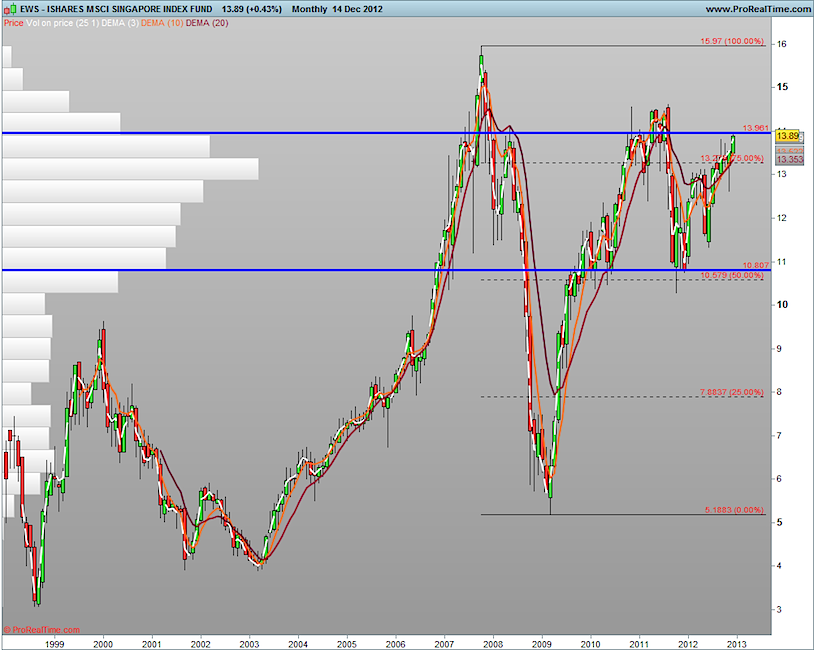
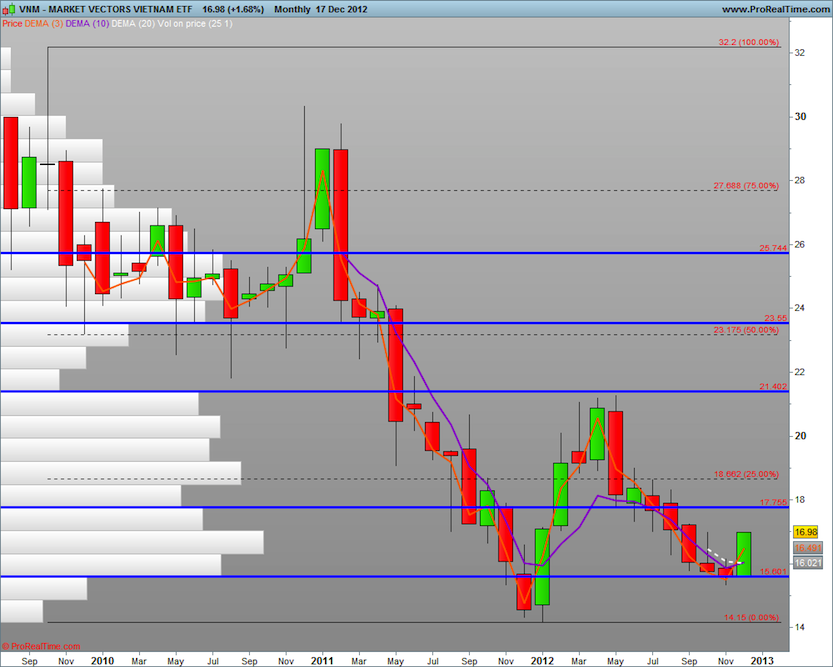
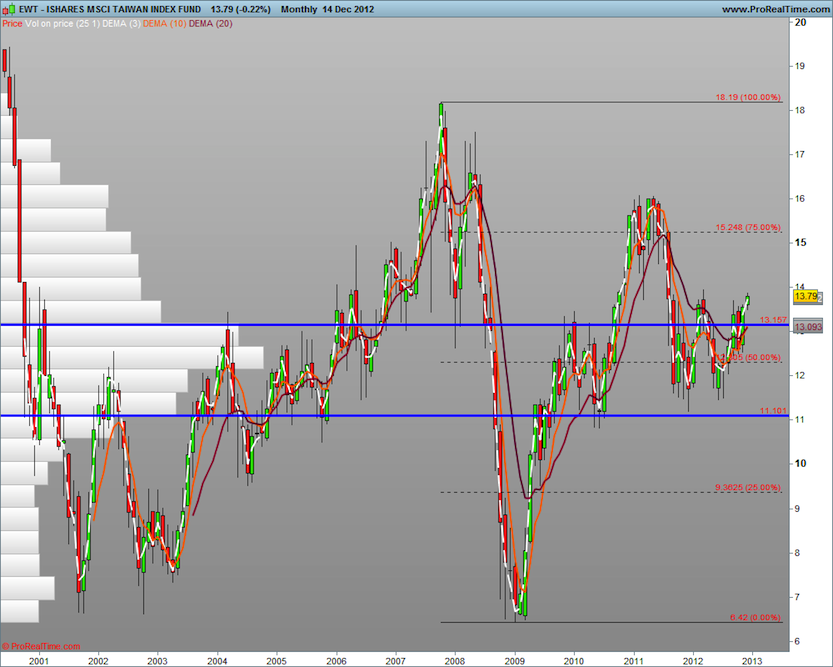
Below are monthly charts for this region’s select country ETFs (Exchange Traded Funds). I decided to use monthly charts as the thesis of sustained economic growth is based on a long-term view, and thus the charts should reflect this intention. Within the charts, I’ve created some horizontal price levels where there’s volume by price (learn more about volume by price) as well as retracement levels that look to support good entry points for long positions.
For long-term positions, I highlight levels where I want to get in and use patience and a percentage buying plan as the stock goes lower: 25%, 25%, 50%. If I don’t get my fill for the 1st and 2nd price points lower then I’ll end up being long with only a 25% position. However, I also adjust opportunity levels as time goes by and previous resistance turns into support. Note that the percentages listed are in relation to a single position size, and are not a percentage of an entire portfolio.
Let’s take a look at the 2 most advanced economies in the sub region- Hong Kong and Singapore. You can see how the charts look very similar. Entries between the blue horizontal lines are probably good initial points of entry. However, I think a monthly close above the upper horizontal line will probably turn that resistance into a good support level. Click to enlarge charts below.
Hong Kong Index Fund (EWH)
Singapore Index Fund (EWS)
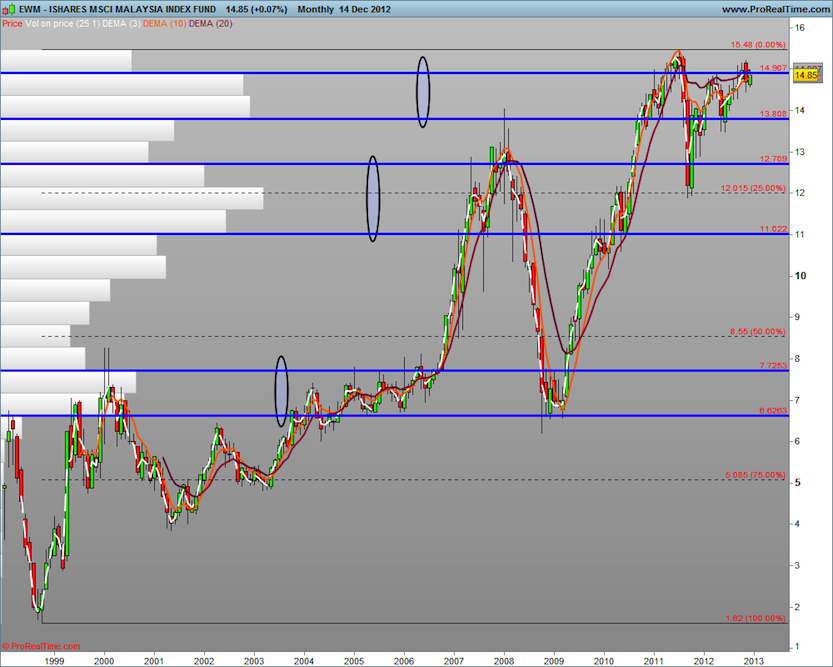
The Malaysia Index Fund (EWM) appears to have formed a double top region around the $15 price level. While there is a decent amount of volume that has built up between $13.81-$14.91, the $12.71-$11.02 area appears to be a less risky entry point.
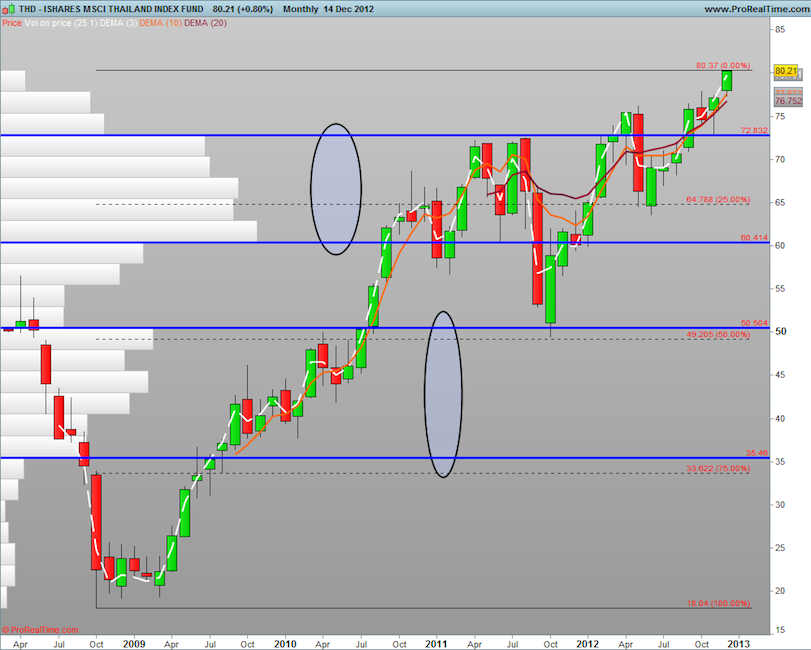
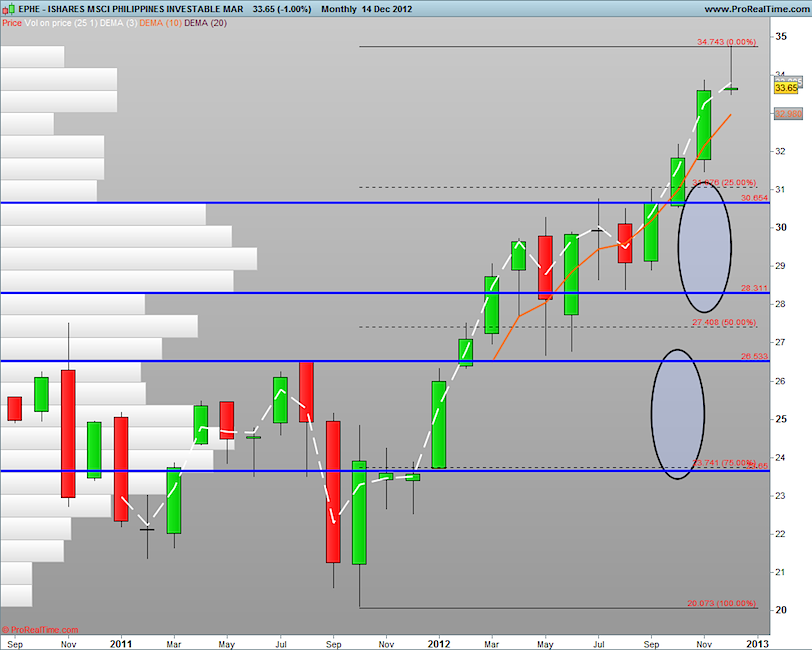
Thailand (THD) and the Philippines (EPHE) are both relatively new issues (something to take into consideration). One can see that both charts are at or near all-time highs, which usually doesn’t offer the best risk reward. As the old adage goes, nothing goes up (or down) in a straight line. Thus, it’s probably prudent to wait for pullbacks before entering new positions.
Thailand Index Fund (THD)
Philippines Index Fund (EPHE)
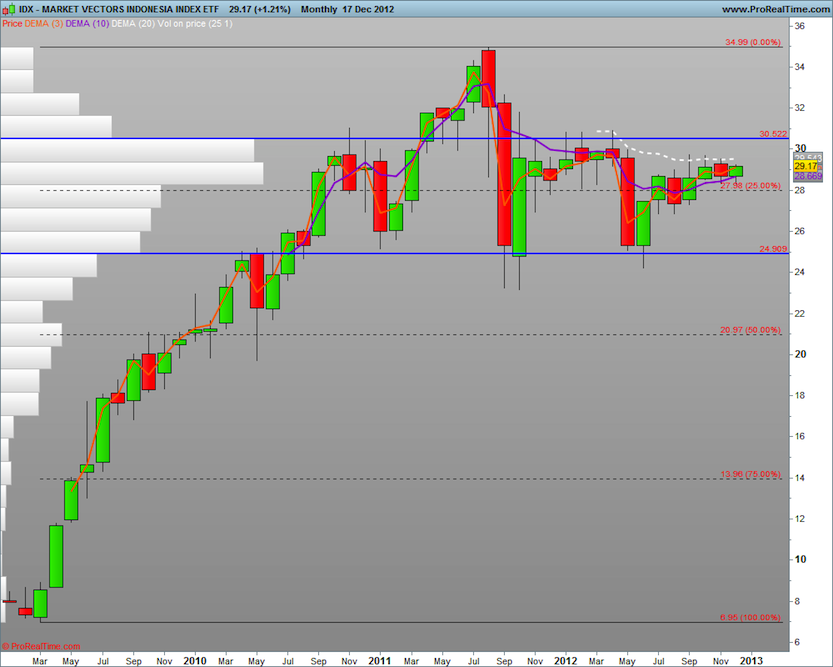
Another relatively new ETF issue, the Indonesia Index Fund (IDX), reached a peak in the summer of 2011 and has since held the support level of just under $25. Volume is building up around the $28-$30.50 price range. However, it wouldn’t surprise me for this issue to dip below $28 and spend some time from there to $24.91 (which is obviously a better entry). Spending more time between $28-$30.50 would be a clue that it may be ready to move above it and head to test the 2011 highs.
Vietnam (VNM) is the laggard based on the development indicators mentioned. However, if it were to follow the same path as its neighbors ETF charts, it may provide a good opportunity to get exposure to the sub region without having to enter on charts that are near their highs. As the one country I don’t have exposure to, I’ve been waiting for an entry closer to the recent low around $15.55. I will have to monitor this closely as I might end up going long on a slight pullback but at a higher than preferred price. If this is the case, I will enter with a smaller position and offset this with a higher than 25% 2nd entry at a lower price. In this chart, the horizontal lines serve as resistance.
Lastly, there is the Taiwan Index Fund (EWT). You can see that the ETF had a large 12 month drop that commenced in late 2001. It took roughly 6 years to recover a good portion of that drop only for it to give it all back during the financial crisis of 2008/09. It appears that it might move towards $15 (and possibly $18), albeit the road to get there will likely be a choppy one. One thing to note on the EWT is that it acts like the QQQ in that 20% of the EWT is weighted towards a single stock – Taiwan Semiconductor Manufacturing (TSM). So this is something to consider if thinking about taking a position in this instrument.
This brings us to the end of the 3 part series covering the sub region of Southeast Asia. Thank you for reading along and I hope the series opened your eyes to a new and growing part of the world.
One final note, while I have stated my positions below, do know that when available, I supplement my stock positions with options.
Twitter: @cerebraltrades and @seeitmarket
Author holds positions in iShares MSCI Hong Kong Index (EWH), iShares MSCI Philippines Invstb Mkt Idx (EPHE), iShares MSCI Singapore Index (EWS), iShares MSCI Taiwan Index (EWT), iShares MSCI Malaysia Index (EWM), iShares MSCI Thailand Invest Mkt Index (THD), Abereen Indonesia Fund (IF) at the time of publication.

