Later this morning, the Bureau of Labor Statistics publishes it’s monthly Non-Farm Payrolls report (what it refers to as “The Employment Situation”).
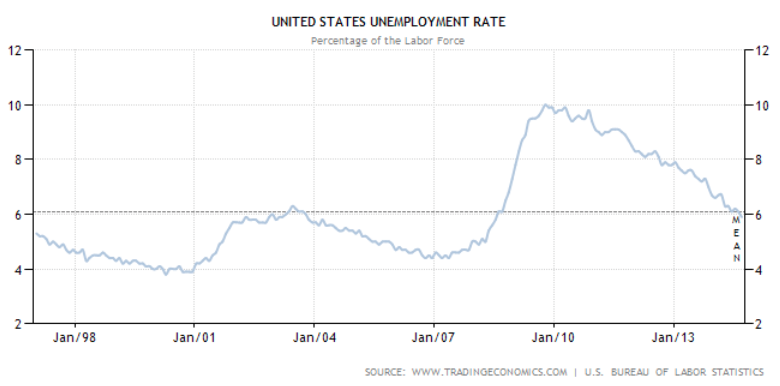
The benchmark U-3 Unemployment Rate is projected to hold steady at 5.9%, which maintains a level just below the mean developed over the last several cycles:
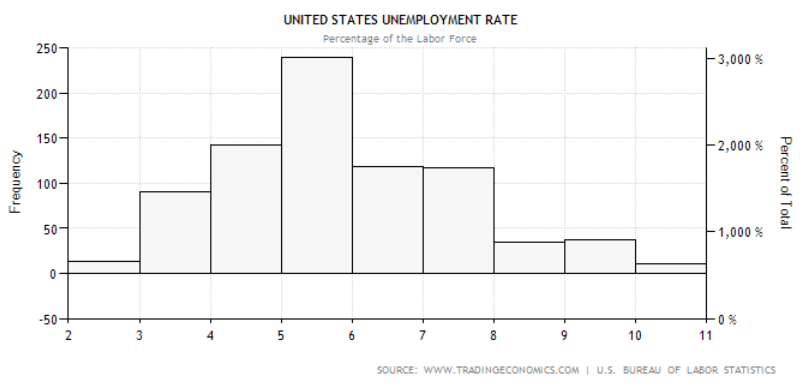
In case that seems skewed by 2008-2009’s elevated levels, here’s the distribution of U-3 data from 1939-Present. As you can see, a 5-handle is the most common:
Mission Accomplished, Fed?
Analyst consensus sees few surprises in today’s release, with NFP forecast at 235k versus 248k previously.
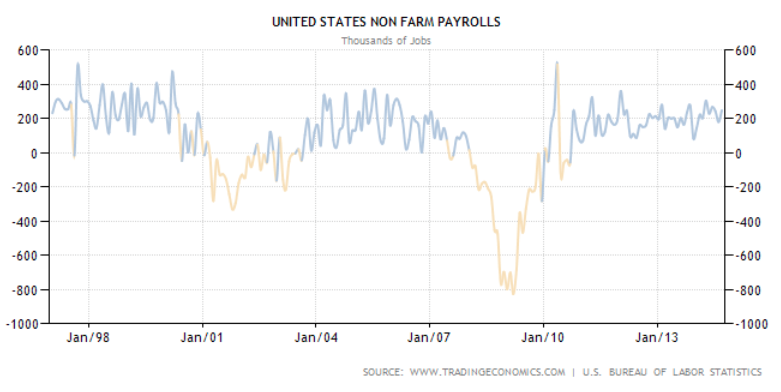
7 of the last 8 NFPs and 9 of the last 12 NFPs. have been over 200k, a trend that is evident in the decidedly calm NFP data for this cycle. In fact, this is now the longest cycle on record (just beating 1986-1990) of consecutive months of NPF above 0. Here you can see Non-Farm Payrolls in comparison to the two previous cycles:
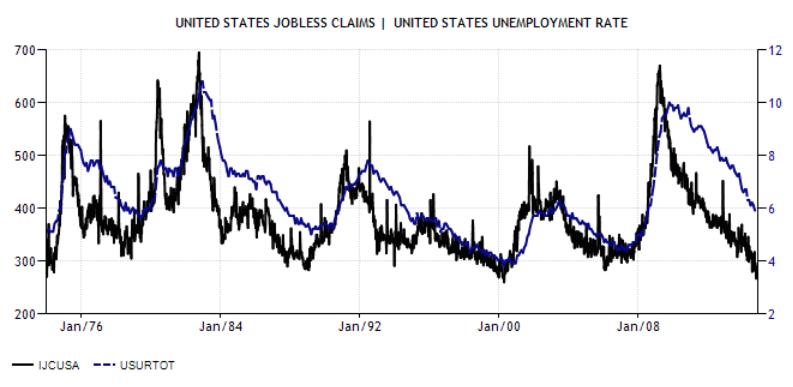
So is this cycle nearing it’s expiration date? U-3 tends to lag but track Weekly Initial Jobless Claims very closely. Judging by how these measures have correlated over the last 5 major cycles (40 years), the answer is “yes”:
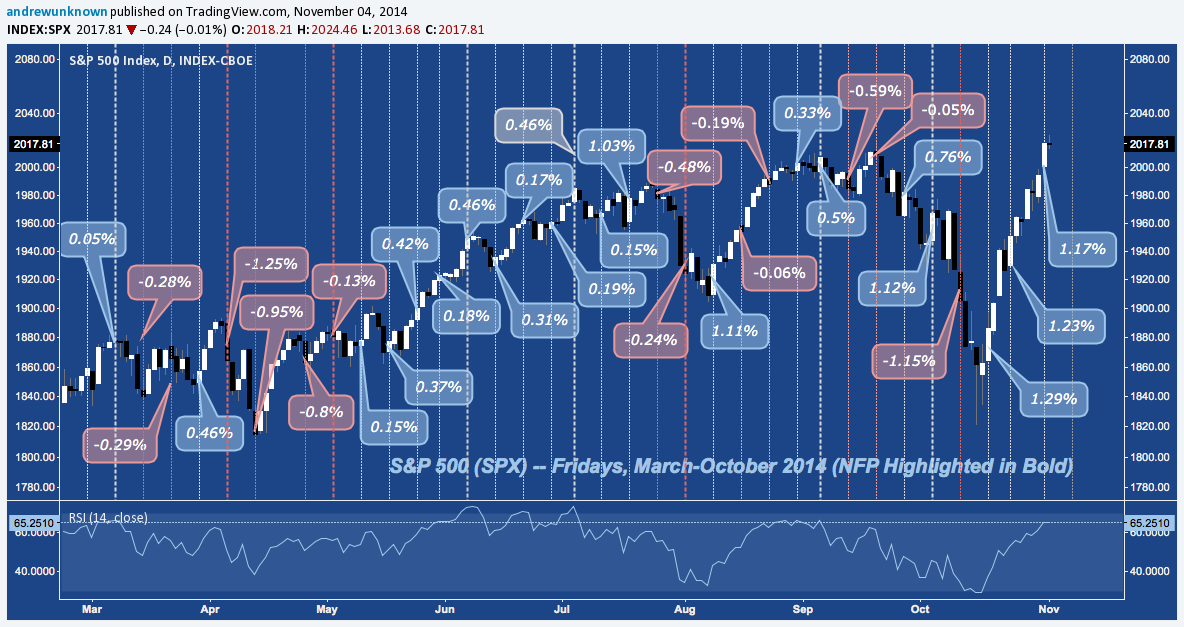
Zooming in to the present, how have stocks performed on Fridays in general, lately; and on NFP day specifically? Here are a few stats on S&P 500 (SPX):
Fridays:
- Fridays YTD (n=42): -0.09% average.
- Several major runs in 2014: 4/5 negative in January; 6/7 negative in March-May; 10/10 positive in May-July; 4/5 negative in July-August. 7/10 positive in August-October.
- 7 of the last 10 Fridays have been positive: +0.46% average.
- 4 of the last 5 have been positive: +0.73% average.
- 5 of the last 5 finished higher or lower by greater than +/- 1%.
And on NFP Fridays:
- 12 of the last 15 (80%) NFPs have been positive: +0.43% average.
- Positive NFPs average (N=12): +0.62%.
- Negative NFPs average (N=3): -0.54%
Here’s a composite view of these performance statistics broken down over the last 6 months:
Twitter: @andrewunknown
Author holds no exposure to asset classes mentioned at the time of publication. Commentary provided is for educational purposes only and in no way constitutes trading or investment advice.
 Ready To Break Out?")


 Rolling Over At Key Fibonacci Level?")
 Ready To Break Out?")
