Pundits, analysts and traders – contentedly oblivious any other time – have fallen under the spell of Japanese equities, rates and monetary policy after the Nikkei 225 (NKY) exploded higher Friday following the tandem release of the Bank of Japan’s (BoJ) latest monetary policy statement promising still more Quantitative and Qualitative Easing (QQE) and the GPIF’s statement presenting yet another new target allocation for their $1.1 trillion portfolio that will add hundreds of billions in domestic and international stocks.
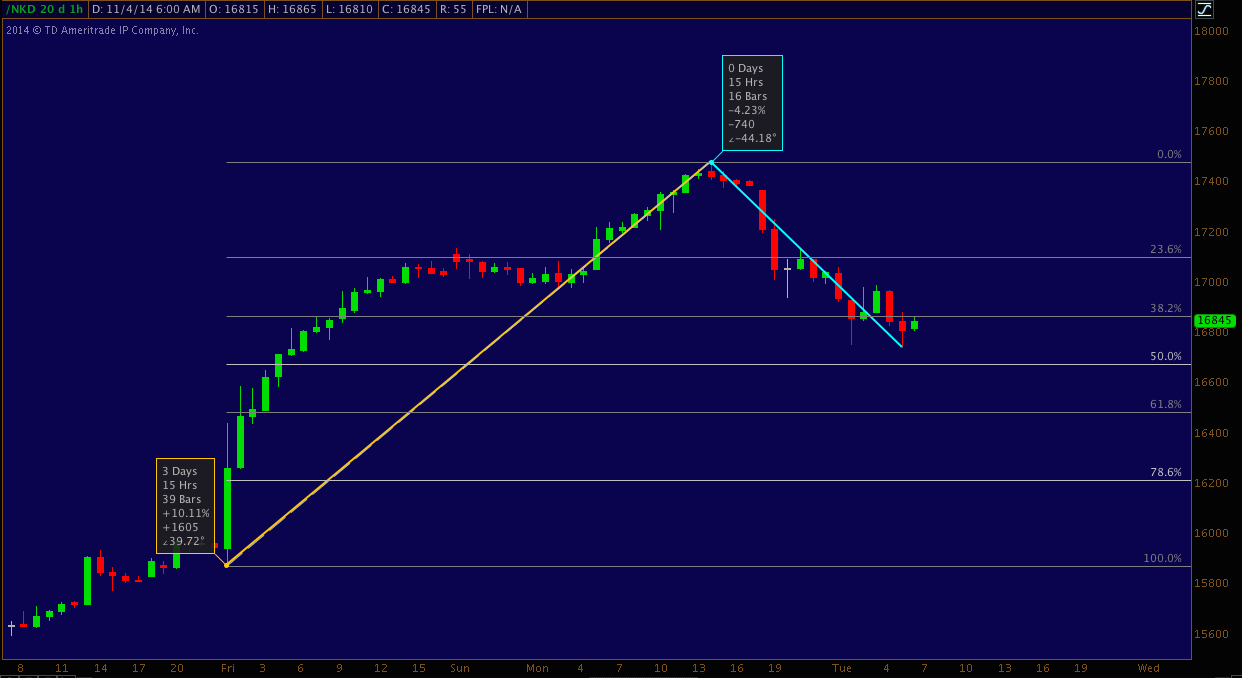
The Nikkei’s response? +10.1% from release to yesterday’s peak around 2:30 p.m. ET, adding +$298 Billion in market cap to the NKY. For reference, that’s 6% of Japan’s 2013 GDP ($4.9Tln). But, piques of market fascination are fickle – and nowhere more so in the DM equities than Japan. As you can see, Friday/Monday’s 1600 point gain has suffered a 46% retracement (-4.23%) over just the last 16 hours:
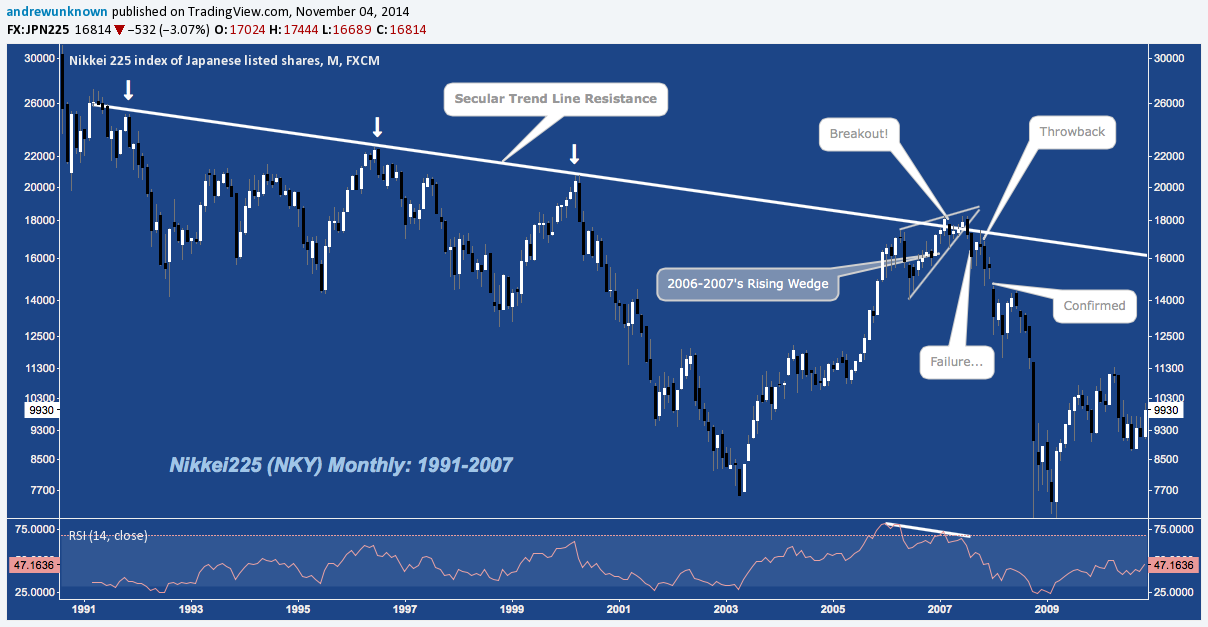
Despite the pullback (variously described elsewhere as “profit-taking”, “healthy” and “moderating to a sustainable path”), the Nikkei’s fresh victory over it’s decades-long descending trend line (white) has not come undone:
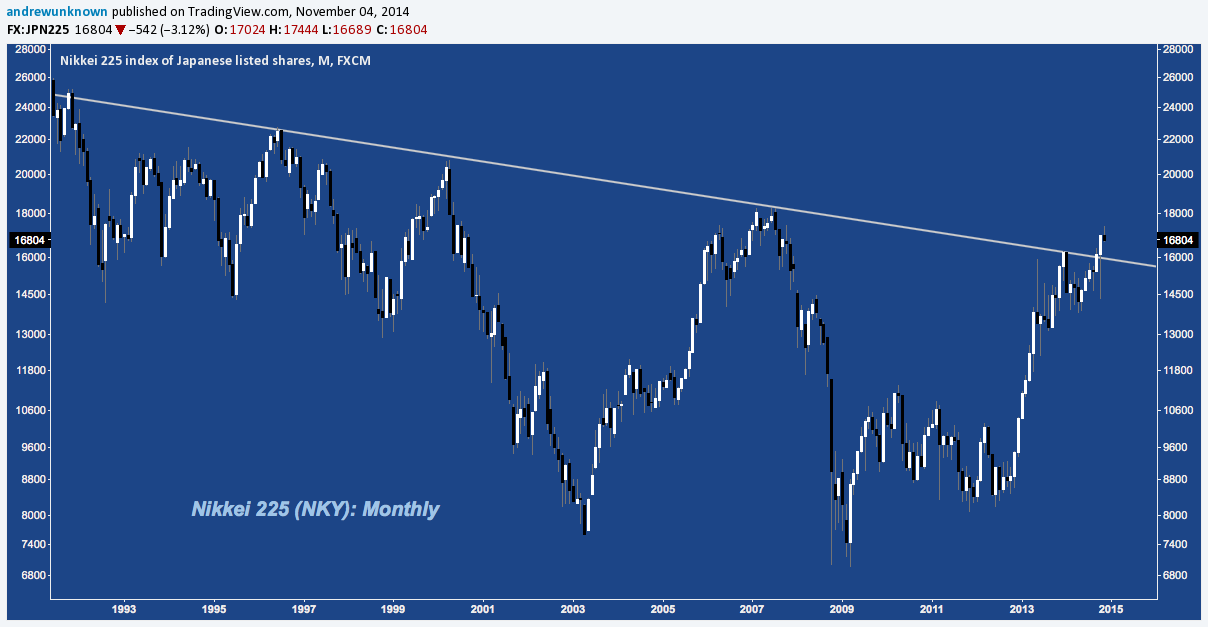
Not yet, anyway. NKY – like Japan and its “deflationary mindset” – isn’t quite out of the woods.
- Major Horizontal Resistance from the 2007 top lies overhead around 18000
- 2013-2014’s Rising Wedge isn’t yet in the rearview, and is currently posing resistance near 17100.
- The Potential Reversal Zone (PRZ) for 2007-2014’s Harmonic Bearish Bat is also at 17100-17300.
- There’s a Negative Monthly RSI Divergence versus December 2013’s high (see bottom panel) – Not dissimilar to 2007.
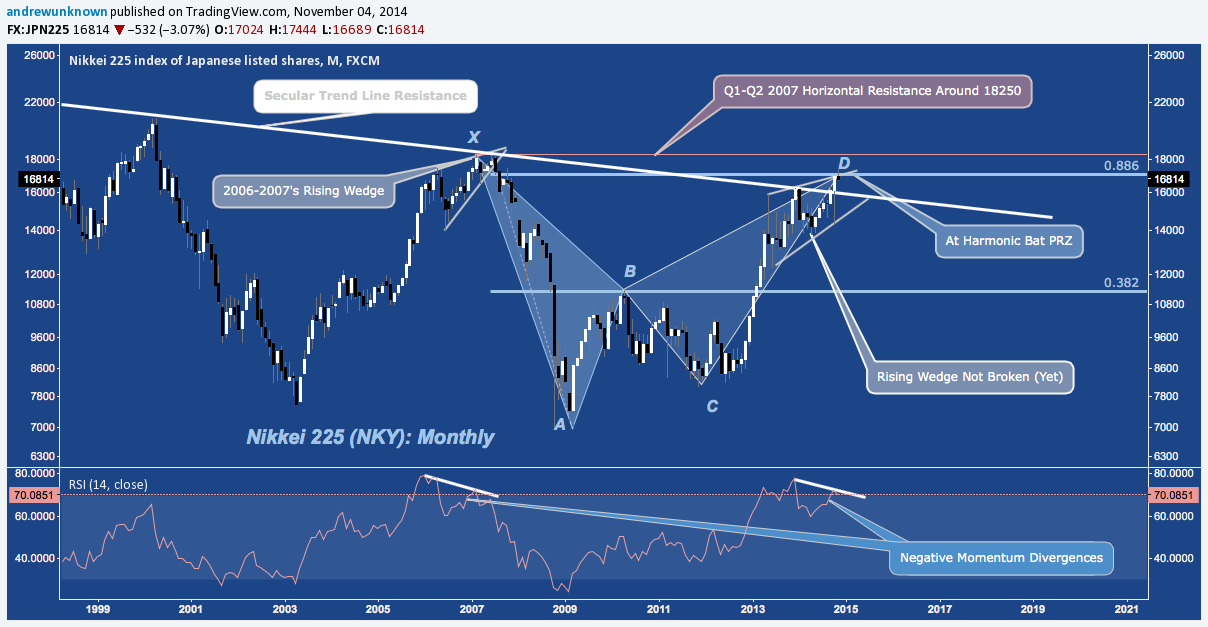
But, the secular descending trend line is broken; and unless that breakout fails, it’s difficult to make anything more than a short-term countertrend short argument for the Nikkei225. After all, the BoJ is going to now buy $265 Billion (up from $88.5 Billion at 113 USD/JPY) in domestic and foreign ETFs each year; and the GPIF is going to add an additional $255 Billion in domestic and foreign stocks under it’s new policy asset mix. What could go wrong?
History provides a cautionary tale. Take a look at Japan’s 5-year QE regime in March 2001-March 2006 (this isn’t Japan’s first go-around at deflationary rodeo) for perspective. QE took 2 years to arrest NKY’s decline, after which the index retraced nearly 80% of the 2000-2001 losses in a move almost identical (10696 points, or +140.66%) to 2009-Present (10473 points, or 150.24%). NKY rallied to and broke through the same secular descending trend line it just breached: in a rising wedge, with a conspicuous Monthly RSI negative divergence. Here’s how one writer for Contraryinvestor.com put it in late 2006, with the all-important caveat about “excess liquidity” that seems strikingly familiar?
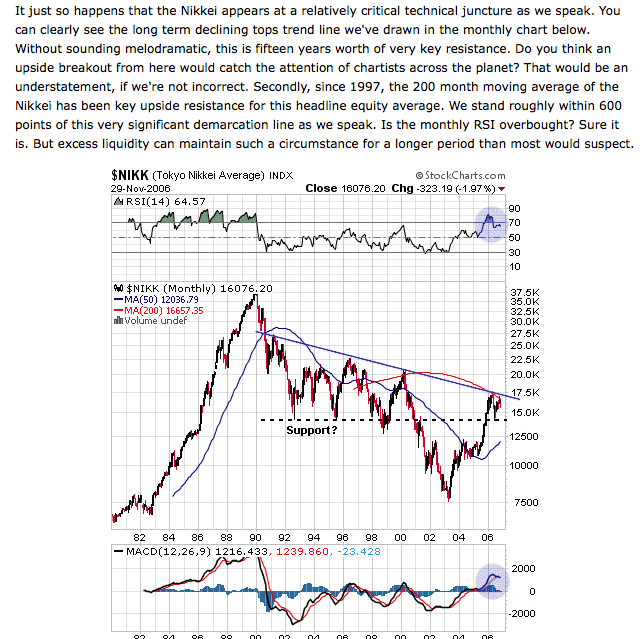
And the not-so-contrarian followup that top-ticked the cycle in February 2007, just shy of the “modest” target area at 20,200-20,800.
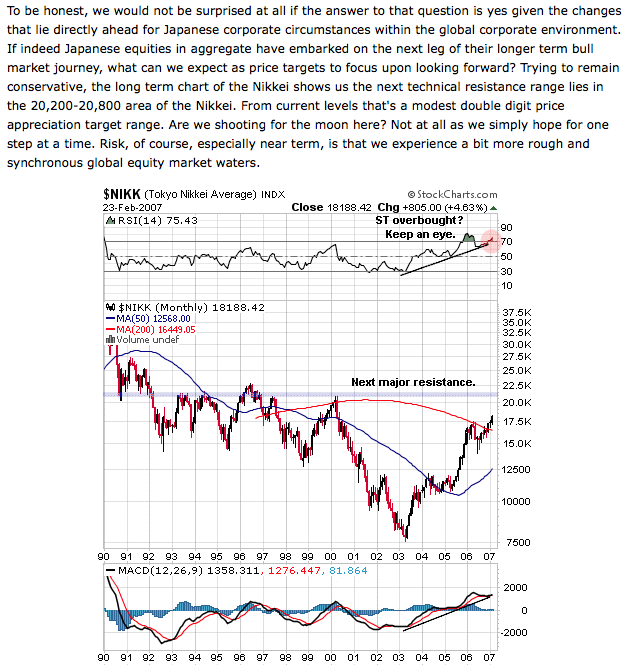
Here’s the full arc of that QE cycle, the secular trend line breakout, and the reaping of all the attendant benefits that are a foregone conclusion under the auspices of the BoJ’s “excess liquidity”. You’ll notice the trend line is different here; but this is exactly how it would’ve been drawn at that time:
The Nikkei seems close to an exit after a long sojourn that has always ultimately taken it further downhill. Is this time different; or will the index follow the precedent of false hope set in 2007?
Twitter: @andrewunknown
Kassen holds no exposure to securities/instruments mentioned at the time of publication. Commentary provided above is for educational purposes only and in no way constitutes trading or investment advice.


