 After an historic stock market run higher for the Nikkei 225, many investors and economists began to ponder the positive effect Abenonmics. But a volatile, wide-ranging sideways move has brought attention to Nikkei underperformance. And so uncertainty is at the forefront again.
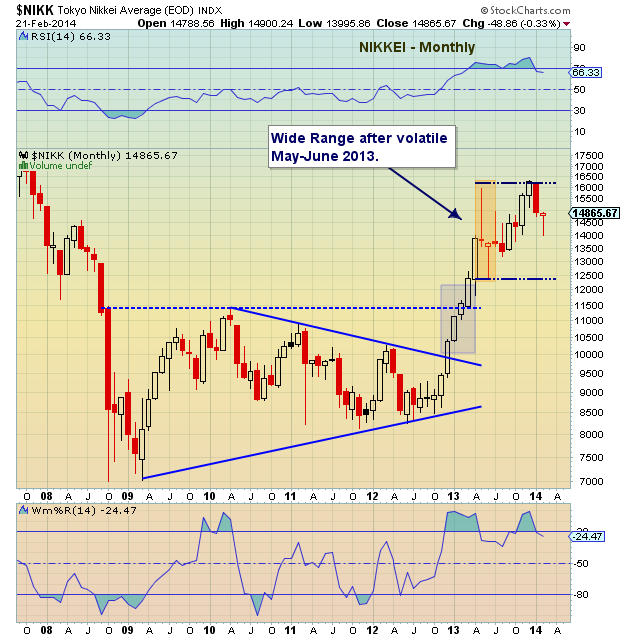
To illustrate this, below is a monthly bar chart of the Nikkei. After reaching up near 16,000, the index fell back to 12,500 over one months time. And this volatile price action set up a very wide range that has seen the Nikkei swing up and down. This action is reasonable and within the bounds of consolidation… after all, the index jumped from 8,500 to 16,000 in 7 months!
Nikkei Monthly Bar Chart
BUT, the recent underperformance is noticeable and bears watching, especially if investors are interested in allocating funds to Japanese stocks. Giving credit where credit is due, fellow contributor Andrew Kassen called for the current Nikkei correction back in December.
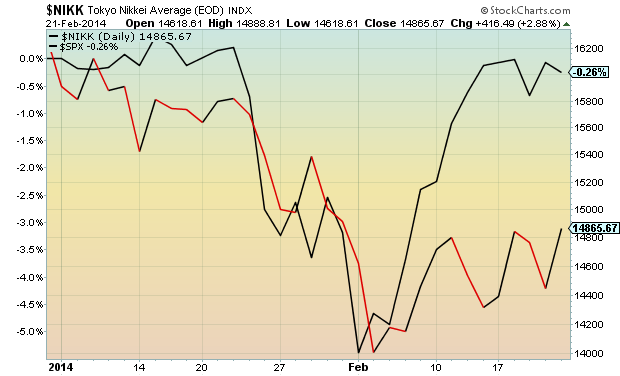
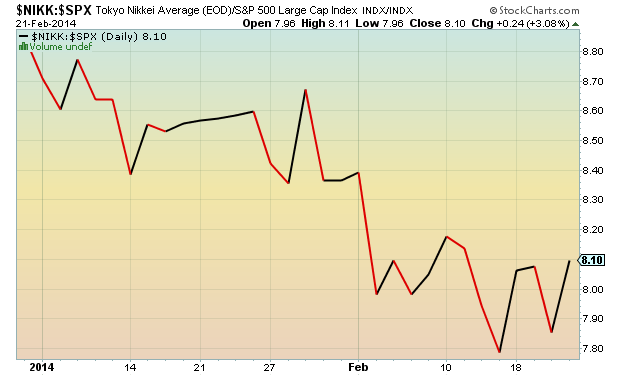
Below are two charts highlighting year-to-date Nikkei underperformance to US equities. Both charts use the Nikkei vs S&P 500, but one is head to head and the other is a ratio chart. The Nikkei has perked up a bit of late, setting up for a potential hammer tail on the monthly chart (should it finish the month strong). However, based on the wide range, only a break of 16,000 would confirm another move higher is underway. Until then, keep an eye on the Nikkei underperformance. Trade safe.
Nikkei vs S&P 500 Chart (YTD)
Nikkei:S&P 500 Ratio Chart (YTD)
No positions in any mentioned securities at the time of publication. Any opinions expressed herein are solely those of the author, and do not in any way represent the views or opinions of any other person or entity.


