Netflix stock has long been a favorite with option traders due to its high stock price, high implied volatility and explosive stock moves. But following the severe selloff in mid-October, Netflix (NFLX) has been very subdued.
Since October 23rd, Netflix stock as traded in a very tight range between $374.60 and $395.52. That’s only a range of 5.5% in the last month for a stock that has a history of moving that much on any given day.
You can see in the chart below that the Bollinger Bands are getting very tight. In fact the Bollinger Band width is the lowest it has been in 12 months.
Netflix (NFLX) Daily Chart
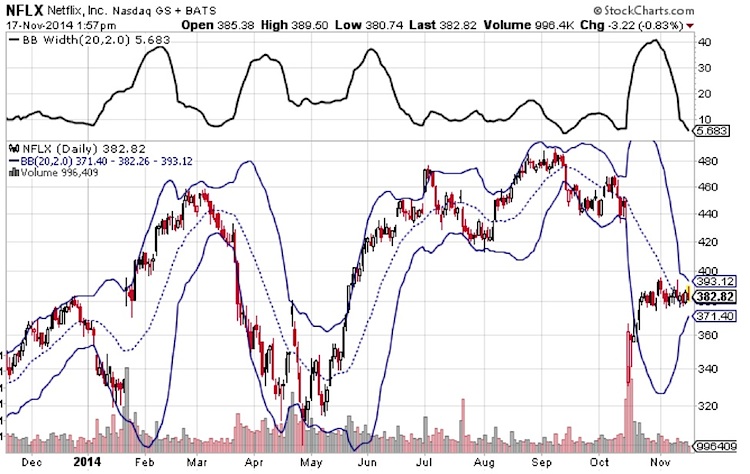
At some point in the next few weeks, Netflix stock is likely to explode.
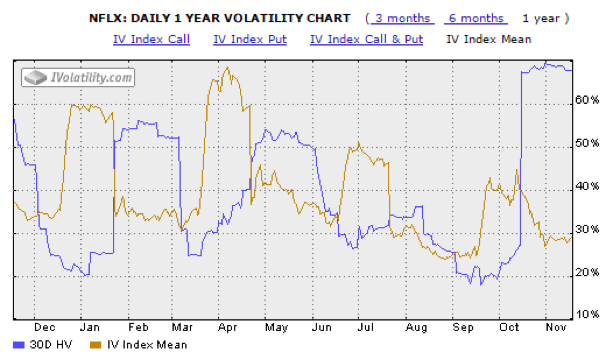
Taking a look now at the implied volatility, we can see that this is also at a very low level in comparison to the last 12 months.
As option traders, we can take advantage of this set of circumstances by playing for a breakout. I have no idea which way the breakout will go, therefore a strategy such as a long straddle or long strangle would make sense.
Here’s how a typical set up for NFLX might look:
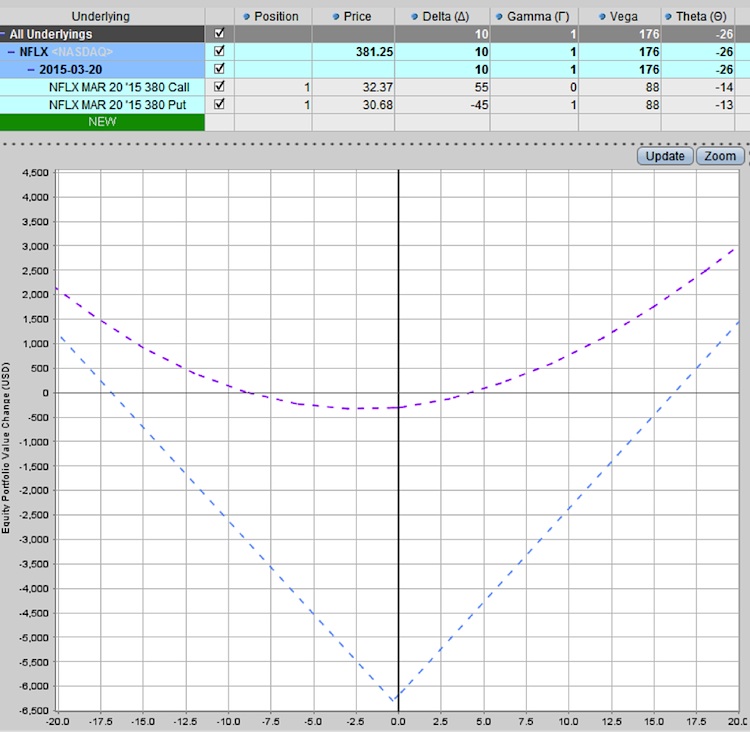
The blue line shows the position at expiry while the purple line is 2 weeks from today. You typically would not hold this position until expiry as you need a huge move to be profitable, but if you get a big move in the next 2-3 weeks, the trade could do very well, particularly if you also get a spike in implied volatility.
Follow Gavin on Twitter: @OptiontradinIQ
No position in any of the mentioned securities at the time of publication. Any opinions expressed herein are solely those of the author, and do not in any way represent the views or opinions of any other person or entity.

")


 Rolling Over At Key Fibonacci Level?")
")
