Volatility has ticked up in the prompt-month Natural Gas Futures (NG) contract. The November contract nearly touched $3.40 in mid-October, but fell sharply last Friday to close the week officially at $2.99, falling another 3 cents in the after-hours session to $2.96. Today, I’ll share my natural gas winter outlook – citing both technicals and fundamentals.
If Natural Gas Prices Can Get Through Resistance…
In early September, I wrote a post on why strong seasonal trends had increased the odds of an NG technical breakout. That breakout occurred around the $3.00 mark. And looking at the chart below, that same area (now roughly $2.70-$3.00) should provide support. You’ll see in the below “volume by price” chart going back to May of 2014 that this range has a very high volume of contracts traded within it. Volume by price is a key indicator technicians use to see what prices or price areas might be significant – the more volume that is traded within a certain range, the more support or resistance a stock or commodity would be expected to encounter.
On the upside, we see initial resistance in the $3.70-$4.00 area for the same reason. From a broader perspective, prompt-month NG has a measured move price target of $4.40 based on a cup-and-handle pattern that triggered when price broke above the psychological and technical $3.00 resistance figure in September. To calculate the price target, subtract the $3.00 prior resistance from the $1.60 bottom in early 2016, then add that difference to the breakout point ($3.00 – $1.60 = $1.40 + $3.00 = $4.40 measured move price target).
Natural Gas Chart w/ Volume by Price

Turning to the natural gas winter outlook (weather), computer models suggest above normal temperatures (bearish NG) to start November. However, then comes a pattern shift in the middle of the month to colder than average temperatures in the Midwest and possibly stretching all the way to the important east coast demand centers. As a technician, I believe that all of the currently forecasted weather is baked into the price of NG. Being a technician, but also a weather enthusiast, this is where it gets a bit fuzzy to identify which pieces of information are material in an analysis. If I formulate a weather outlook apart from the consensus, then I may be able to gain an edge.
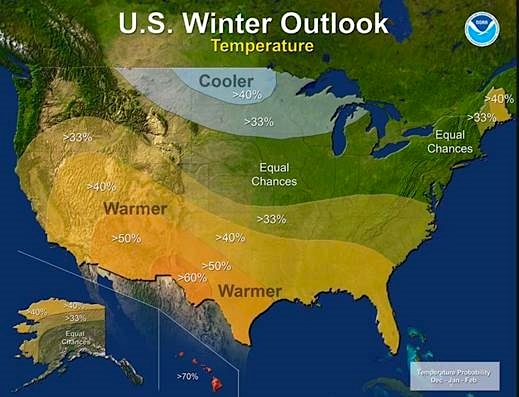
The National Oceanic and Atmospheric Association (NOAA) released their 2016-2017 Winter Outlook last week. For those who follow the longer-term weather models and trends, it was nothing surprising. NOAA expects colder than average risks along the northern tier, with higher than average precipitation chances around the great lakes. The west and south are expected to be warmer than average, while the east coast demand corridor is a toss-up. Again, the NOAA forecast should be taken as the consensus (already factored into the price of Natural Gas). The seasonal forecast released by NOAA is in-line with their “La Nina Watch” that was re-issued earlier this month. La Nina’s tend to support more bullish prices during the winter for NG.
Thanks for reading.
Twitter: @MikeZaccardi
Any opinions expressed herein are solely those of the author, and do not in any way represent the views or opinions of any other person or entity.


