Natural Gas futures (NG) have entered one of its most bullish seasonal periods of the year.
Over the last 20 years, September has been the best performing month for natural gas prices, with October being the 2nd best. So seasonality is in it’s favor right now. That said, it should be noted that the trend has broken down somewhat in the last few years.
Today we’ll look at the current “technical” setup for natural gas futures along with its historic seasonality patterns.
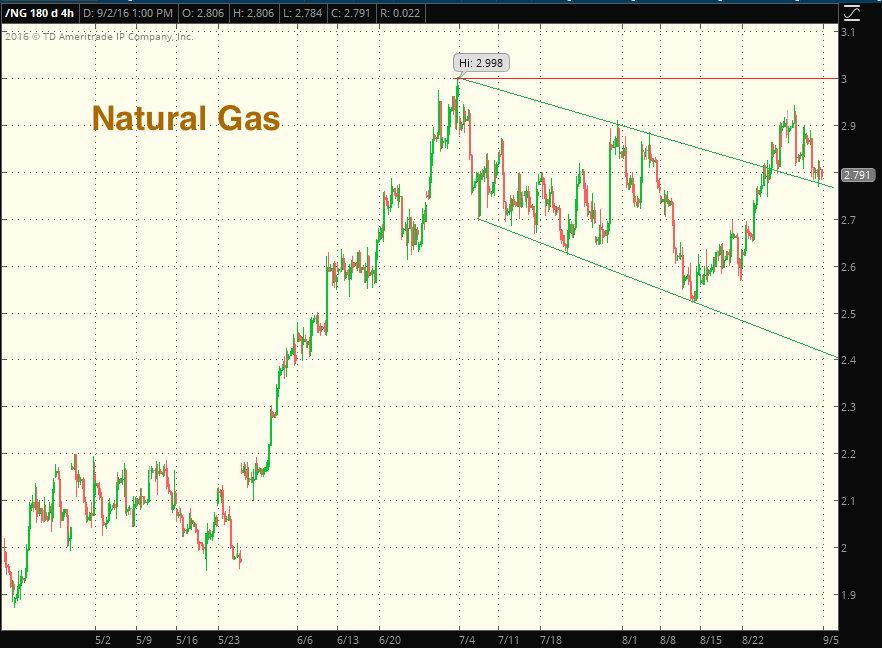
NG 4-hour Chart since April 2016: Bull Flag Broken to the Upside
The top chart below is a 4-hour chart going back to April 2016 – you can see the extended “bull flag” that persisted from early July through late August. Natural Gas prices broke above the flag, and is now consolidating above the prior resistance line. This is a bullish setup as long as price remains above the trend line. A move above the prior high at $2.998 would certainly lend credence to a confirmation of a bullish breakout.
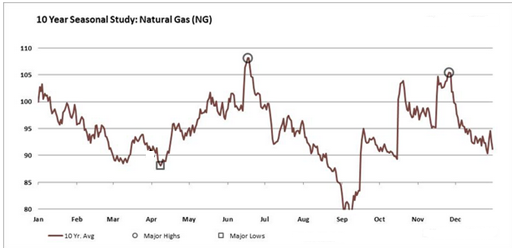
Bullish Seasonality Labor Day through mid-October and Late November
This next chart shows where Natural Gas prices are as far as seasonality goes. Traders have done well buying Labor Day and selling Thanksgiving, on average, over the last 10 years. This chart comes from Signal Trading Group.
Also Read: Crude Oil Seasonality: September Review
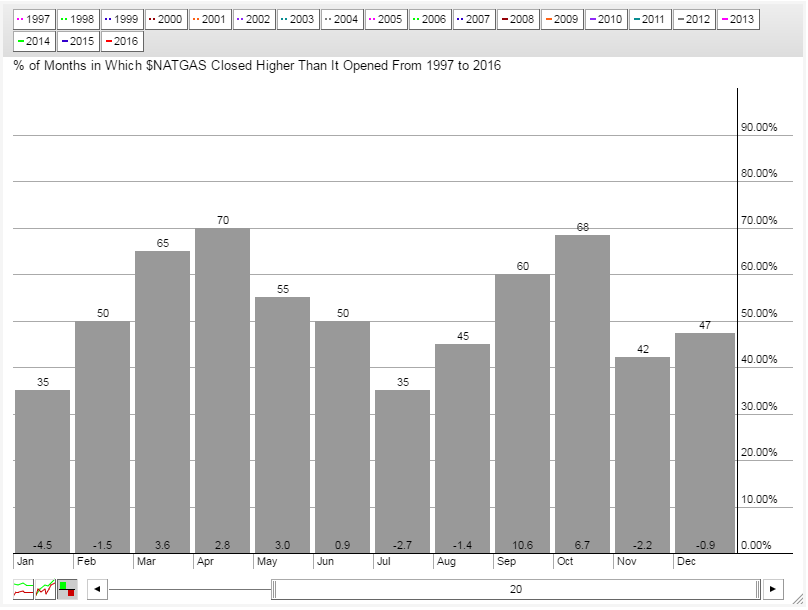
September and October have been the best performing months
This final chart shows seasonality a bit further back than the past 10 years. Stockcharts.com provides a histogram look for the prior 20 years on Natural Gas, along with the average return per month at the base of the bar. You will find that September and October are positive 60% and 68% percent of the time, respectively. They are also the best performing months, with average returns of 10.6% and 6.7% respectively.
Thanks for reading.
Twitter: @MikeZaccardi
Any opinions expressed herein are solely those of the author, and do not in any way represent the views or opinions of any other person or entity.


")

")
 Ready To Break Out?")
