As the major stock market indices march higher, all eyes are on the NASDAQ Composite. This popular tech index is getting a ton of press lately because it’s approaching its former all-time “bubble” highs from 2000. Yep, it took 15 years to get back to these levels. I’m also seeing a lot of “buzz” about how it’s different this time. Well folks, since TIME really doesn’t exist I’m not sure what to say. I digress.
If you go and search my blog (Bart’s Charts), you’ll find that I’ve been doing a lot of work around the “long term” log scale NASDAQ trend line from the low on October 03, 1974. The chart below shows how crucial it’s been as support and how it’s acted as resistance each time the NAZZIE went up and banged into it. It’s the polarity principle, where support becomes resistance and resistance becomes support.
Why log trend lines? Well, for me, on a long term chart they are very powerful to watch for changes in trends. They also keep up with parabolic moves and highlight powerful support and resistance levels.
NASDAQ Trend Line Chart 1974-2015 (log scale)
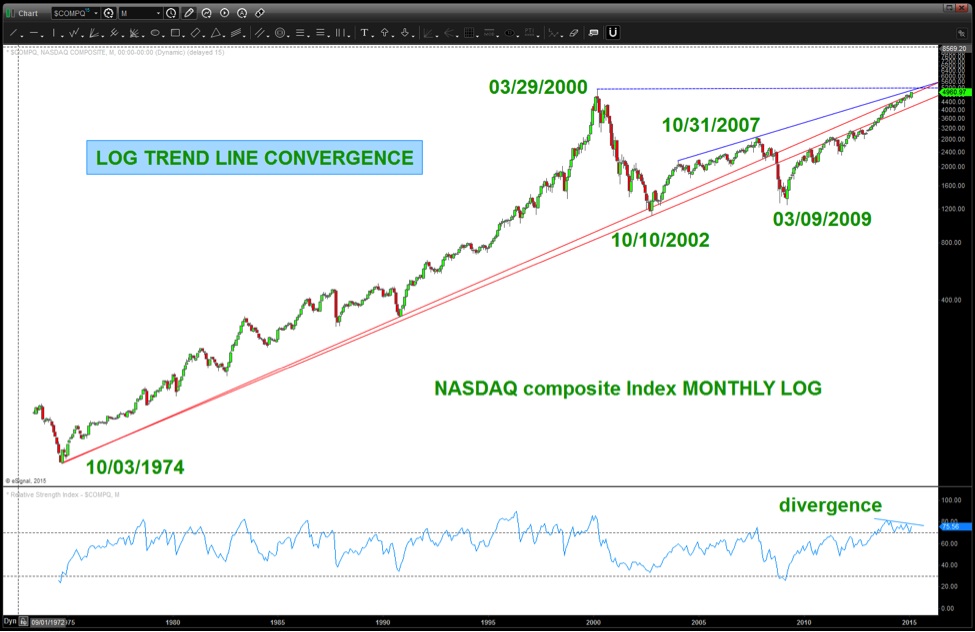
The log scale chart above demonstrates how the NASDAQ has respected and bounced up/down and all around this key trend line. What’s so important now? If you zoom in, you’ll see for the first time “ever” it appears we are going to bust through to the upside and this could trigger another very powerful move higher.
In order to further demonstrate how this looks, I’ll also invert my chart to provide the same picture but from a “bears” point of view.
NASDAQ Trend Line (Inverted)
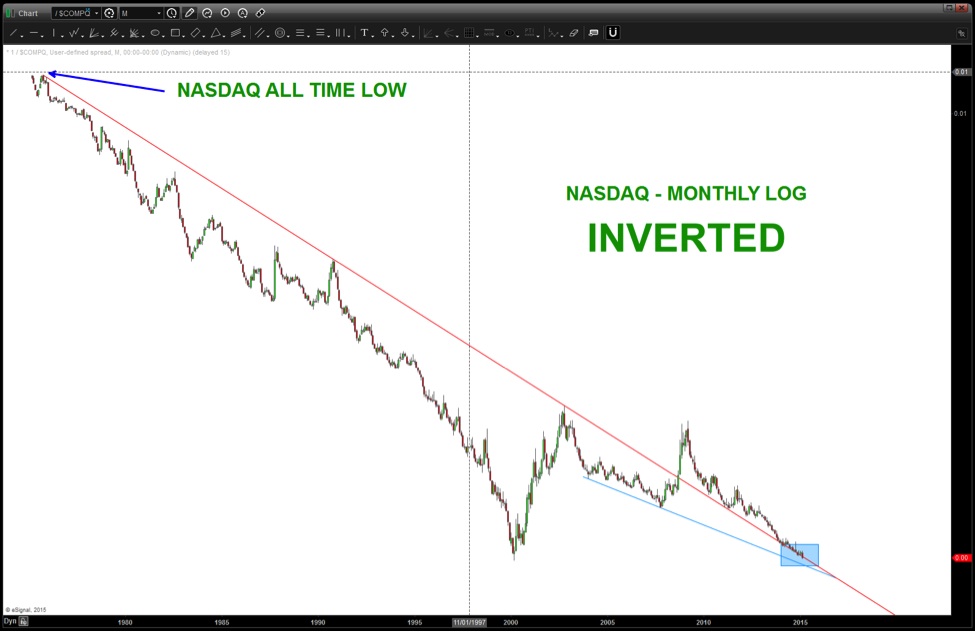
When looking at the chart above, it certainly appears an acceleration to the downside is imminent (and since its inverted, that would mean the NASDAQ breaks out and goes higher).
But, let’s remember that this is a 40+ year chart, so setting up that move could take some time. As well, we also have a significant target just a little higher that could offer some resistance. Using a very powerful technique shown to me by a mentor and friend, Mike Jenkins (Stock Cycles Forecast) when we subdivide the “signal reversal candle” by 1/8th we can project UP or DOWN (depending on the initial move) to derive some powerful targets.
NASDAQ October/March Highs Lows Chart
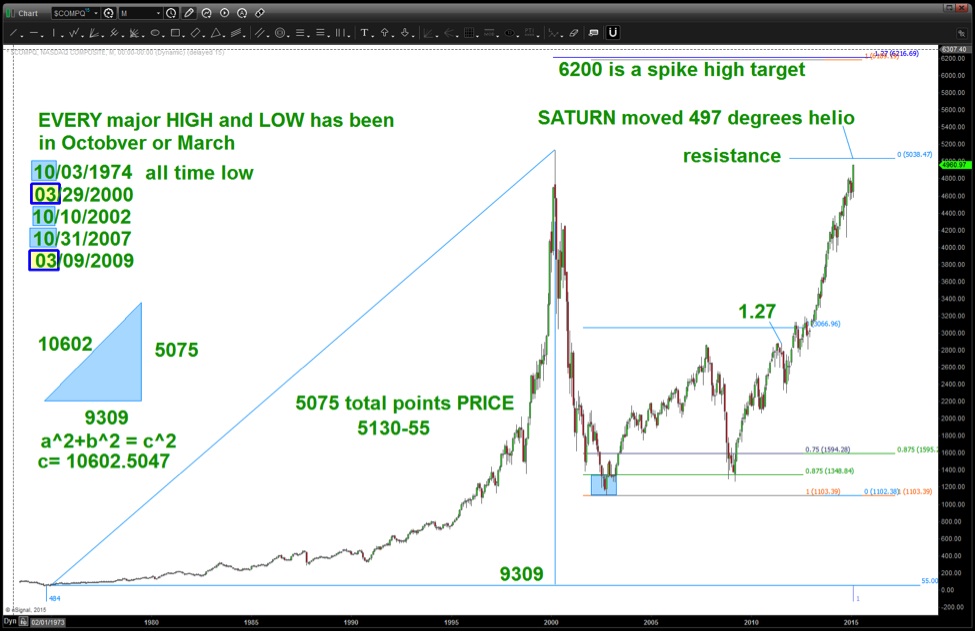
*As you can see, 5038 is going to be a crucial level for the NASDAQ.
Also, for those of you so inclined, Saturn has moved 497 degrees Helio from the all time low and 497 equates nicely with 4970. The NASDAQ closed at 4968 yesterday and 4967 today.
One last note: EVERY major high and low for the NASDAQ has occurred in March and/or October. As we flirt with all-time highs, perhaps some caution is warranted.
It certainly appears that the NASDAQ has a chance to explode to the upside. But it will have to get through the targets mentioned above and move with momentum… under that scenario, the NASDAQ would project to around 6200. One of many reasons to watch the stock market over the coming weeks.
As always, thanks for reading.
Follow Bart on Twitter: @BartsCharts
No position in any of the mentioned securities at the time of publication. Any opinions expressed herein are solely those of the author, and do not in any way represent the views or opinions of any other person or entity.

 Rolling Over At Key Fibonacci Level?")

 Rolling Over At Key Fibonacci Level?")


