 If we turn back the clock to the year 2000, investors were frothing over fruitless tech companies with outsized price to earnings ratios (P/Es). I remember watching the NASDAQ tick higher and hearing speculative talk throughout 1999, with conversations firmly centered around the next “possibility”. The NASDAQ market top in March of 2000 was all about that fervent belief in, and giddiness about, “possibility”. Investors thought they could get rich in a matter of days, weeks, or months… not break even 15 years later.
It’s amazing what 15 years (and some perspective) will do. That fervor into the NASDAQ market top made sense in a vacuum as we were no doubt entering an Age that would be dominated by new and exciting technology: The Information Age. But inspiring tech companies needed time, and a lot of it, to build their moats. Fast forward to today and tech companies have profits, advanced R&D, innovative technology, and increased competition within and across verticals that are driving the sector higher.
As we approach NASDAQ 5000 for the second time in 15 years, it’s important to understand that although some fundamental market dynamics are similar, they are on a vastly different scale. That absolutely does not rule out a substantial correction from current levels – in fact, history shows that getting through “big” levels can take time.
Below are separate charts highlighting the lead up to the NASDAQ market top in the year 2000 vs the current setup. I think there are a couple things worth pointing out.
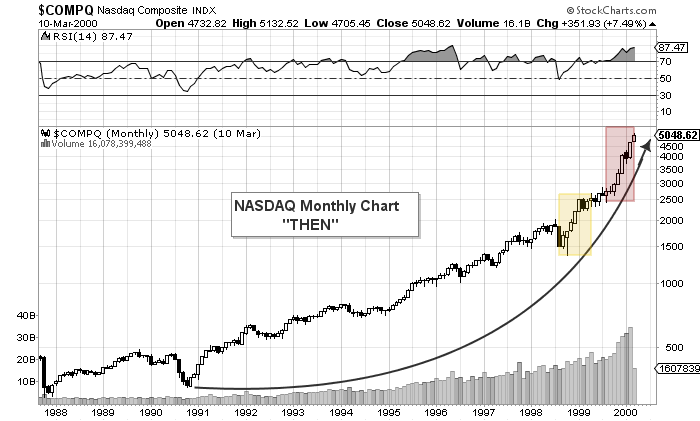
The chart below shows the lead up to the NASDAQ market top in March of 2000. It’s clear that what was an ambitious run higher into 1998 became a slingshot move into the last 2 years. The NASDAQ doubled in 4 months off the 1998 lows, then followed that up with another double in the 8 months leading up to the bubble top. So what seems over zealous turned ridiculous… and fast. This is often times referred to as an Eiffel Tower setup with momentum stocks. But this would leave a lasting scare.
NASDAQ Market Top 2000 – The Drive To The Bubble Highs
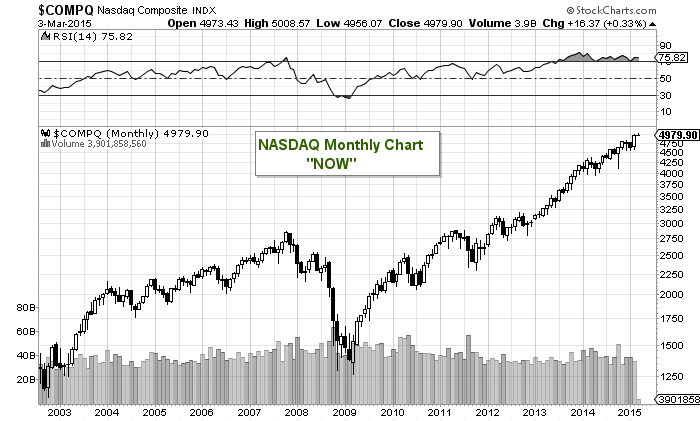
Looking at the current lead up to NASDAQ 5000, you can see a similarities in the “rise” but nowhere near the extent of 2000. Yes, we are overbought and nearing a major price resistance area (up to 5132, the 2000 highs). But the latest “double” took 3 years. That’s a nice move, but nothing that markets haven’t seen before. As well, we are now in a global setting so capital flows and global economic developments are playing a role, and will continue to going forward.
NASDAQ 5000 – A Look At The Current Setup
Perhaps crossing 5,000 again on the NASDAQ should be more of a celebration of the new era and a more mature tech sector. That said, please leave the party hats at home. Any time the market nears “old” highs, especially at big round numbers, it typically takes time to convincingly break through. Often times, months. So as we approach the March 2000 high of 5132.52, it’s a good time to note that the sector is on much stronger grounds, but that a breather may around the corner.
Follow Andy on Twitter: @andrewnyquist
Any opinions expressed herein are solely those of the author, and do not in any way represent the views or opinions of any other person or entity.
")


